Fig. 1.
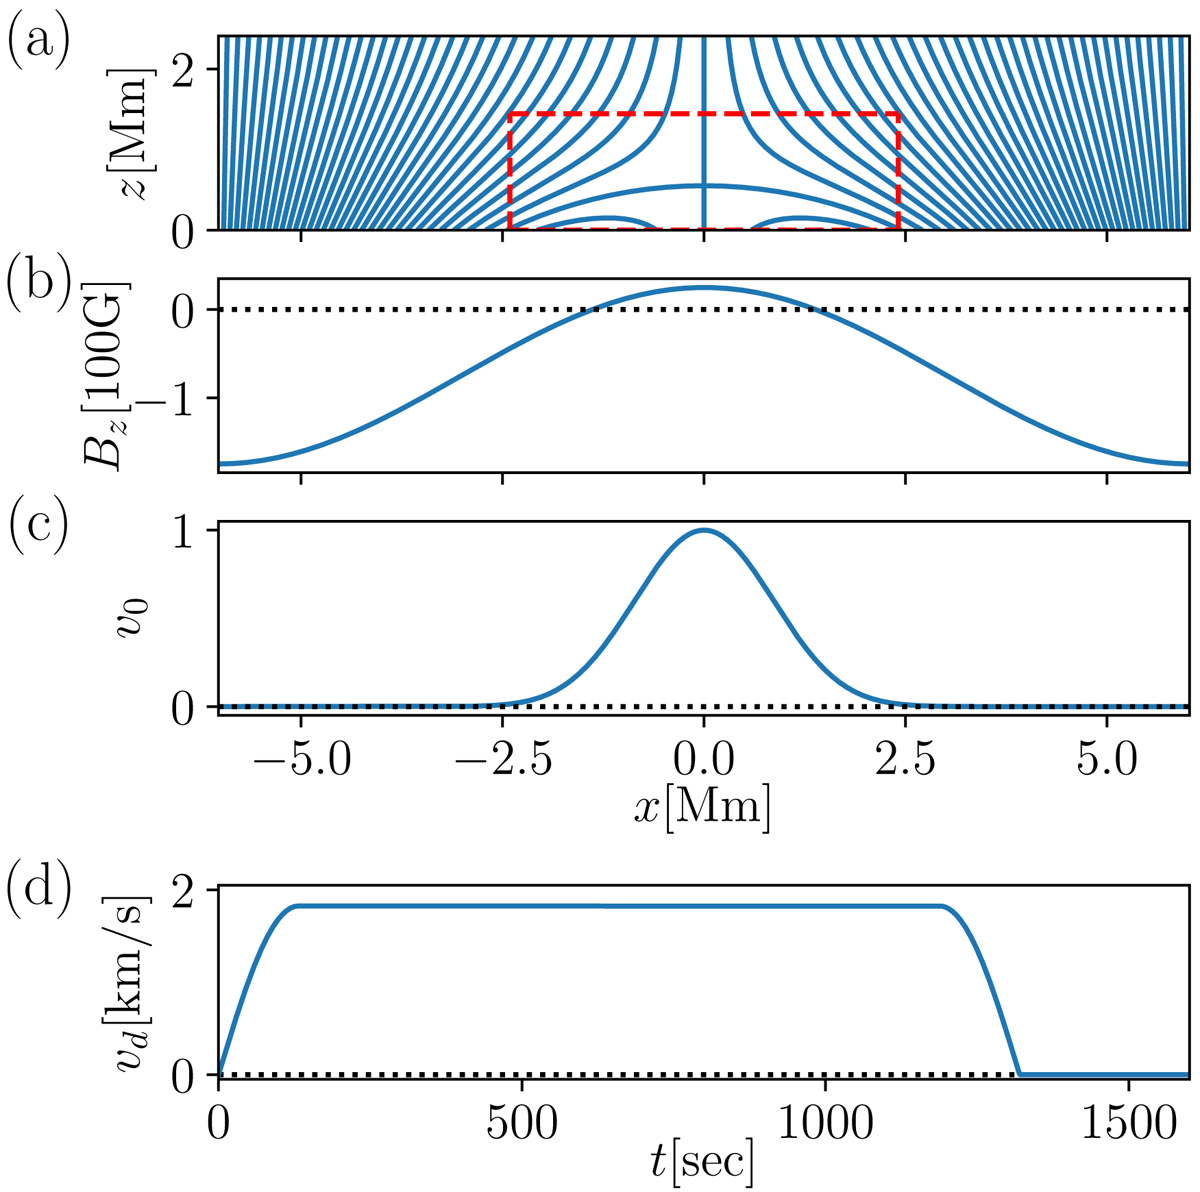
Model setup. In panel a we show the initial condition of the magnetic field through the field lines in the 2D computational domain following Eq. (5). Panel b: displays the vertical component of the magnetic field at the bottom boundary at z = 0. The magnetic field is driven in the positive x-direction with a Gaussian-type velocity profile v0(x) as defined in Eq. (8) and depicted in panel c. The peak value of the driving velocity vd(t), given through Eq. (9), is shown in panel d. While panel a shows the full computational domain, the red dashed rectangle indicates the region of interest displayed in Fig. 2. See Sect. 2 for details.
Current usage metrics show cumulative count of Article Views (full-text article views including HTML views, PDF and ePub downloads, according to the available data) and Abstracts Views on Vision4Press platform.
Data correspond to usage on the plateform after 2015. The current usage metrics is available 48-96 hours after online publication and is updated daily on week days.
Initial download of the metrics may take a while.