Fig. 5.
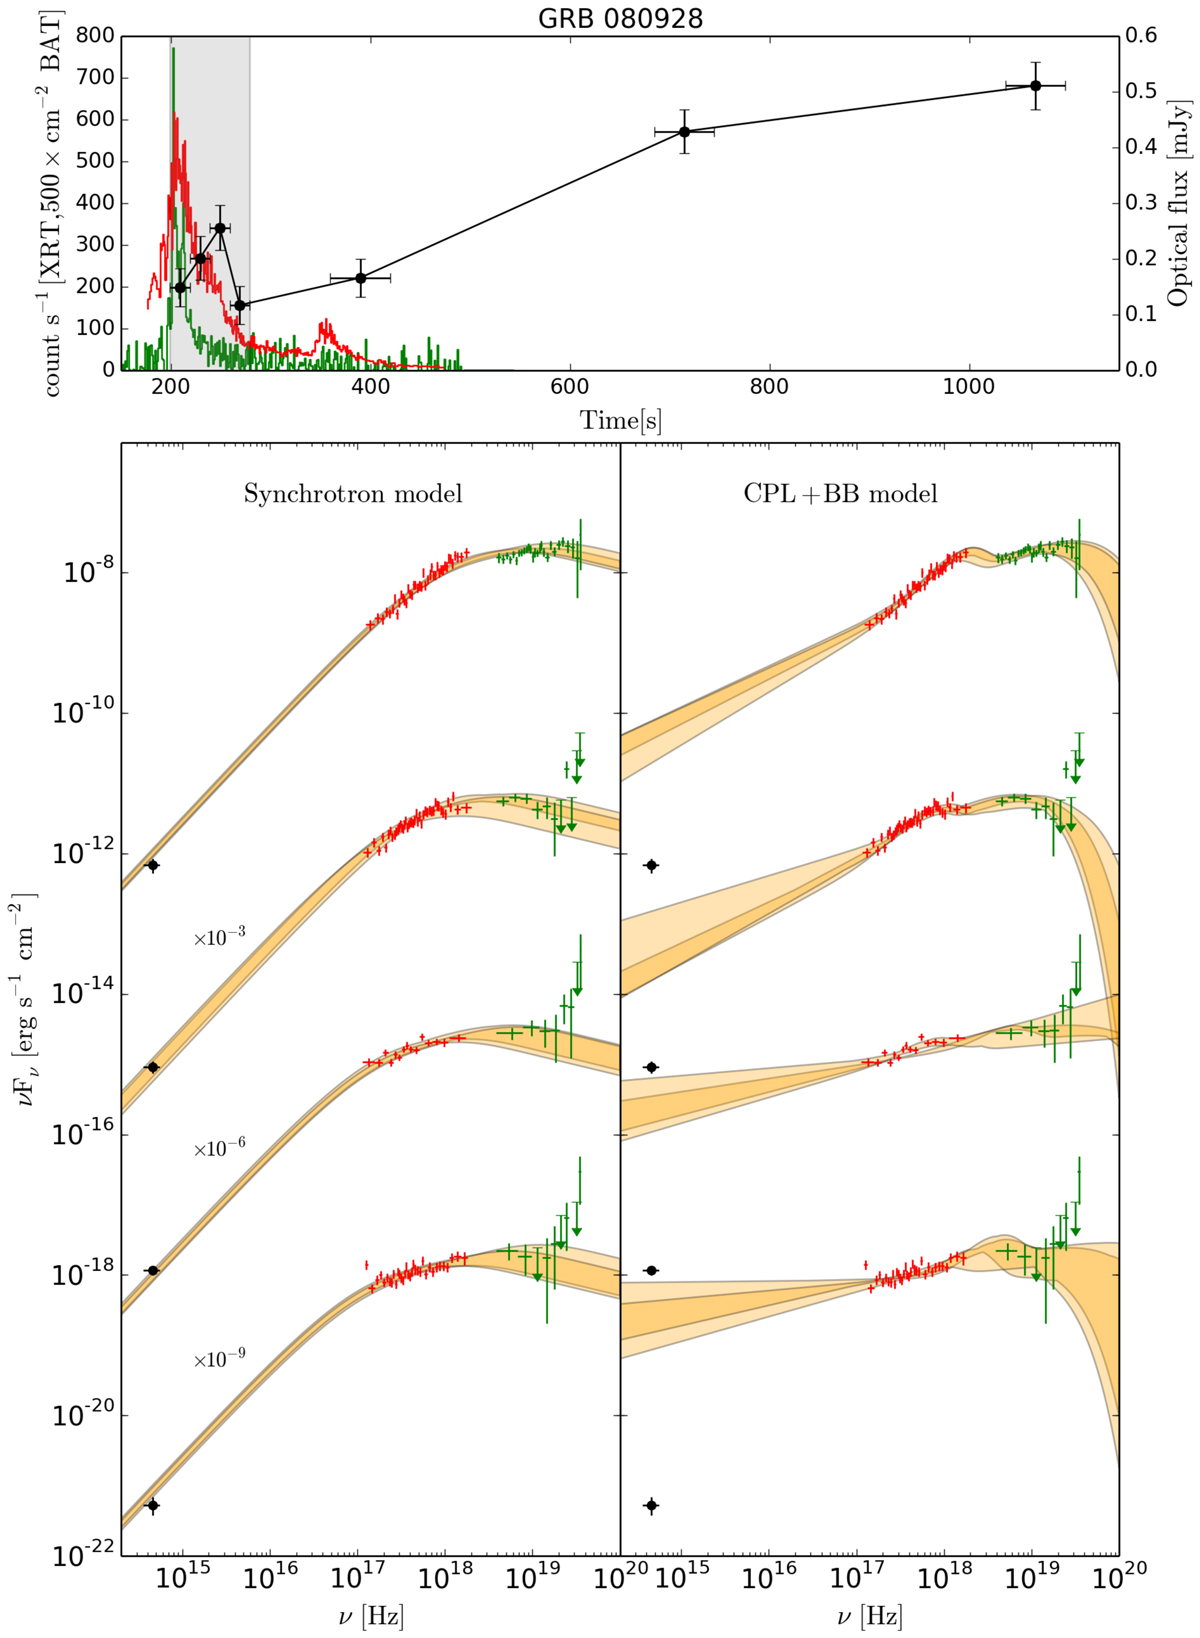
Results of time-resolved spectral analysis of the prompt emission of GRB 080928. Upper panel: XRT (red), BAT (green), and optical (black) light curves. Bottom panels: Synchrotron (left) and BB+CPL (right) fits to XRT (red) and BAT (green) spectral data corresponding to the time interval highlighted in grey in the upper panel. Black filled circles show the optical flux. XRT spectra are de-absorbed. The best-fit confidence regions are shown in orange: light orange for contours derived when the normalisation of BAT data is kept fixed and that of XRT is free to vary between 0.9 and 1.1, and dark orange contours for the opposite situation.
Current usage metrics show cumulative count of Article Views (full-text article views including HTML views, PDF and ePub downloads, according to the available data) and Abstracts Views on Vision4Press platform.
Data correspond to usage on the plateform after 2015. The current usage metrics is available 48-96 hours after online publication and is updated daily on week days.
Initial download of the metrics may take a while.