Fig. C.2.
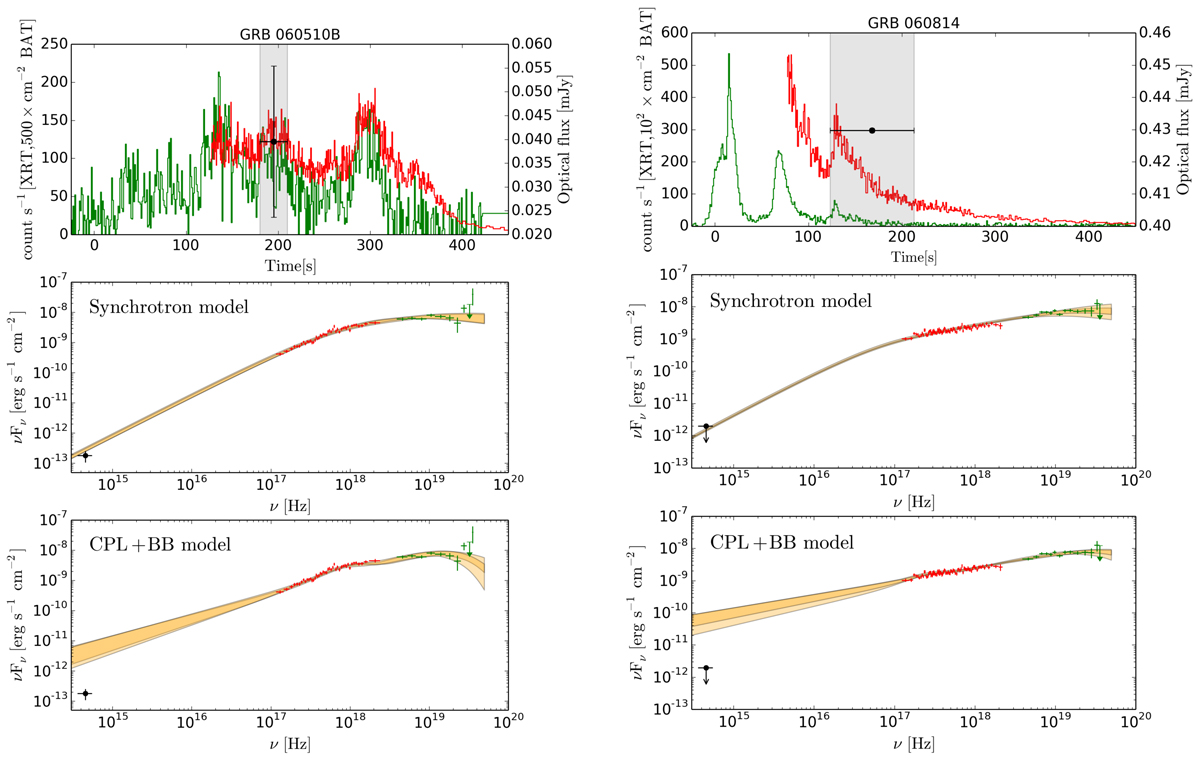
Results of the spectral analysis of 15 GRBs with single-epoch optical observations. For each GRB the upper panel shows the XRT (red), BAT (green), and GBM (blue, if available) light curves. The black symbol shows the optical observation. The shaded grey region corresponds to the time-window of the optical exposure, where the joint XRT+BAT(+GBM) spectral analysis is performed. The synchrotron and BB+CPL fits to XRT+BAT(+GBM) spectra are shown in the middle and bottom panels, respectively. The XRT flux has been de-absorbed. The best-fit contour regions are shown in orange: light orange is used for model derived when the calibration constant in fixed on BAT data, and dark orange when it is fixed on XRT data. The optical fluxes for each time-bin (in black) are added to compare with the low-energy extrapolation of the synchrotron and BB+CPL models.
Current usage metrics show cumulative count of Article Views (full-text article views including HTML views, PDF and ePub downloads, according to the available data) and Abstracts Views on Vision4Press platform.
Data correspond to usage on the plateform after 2015. The current usage metrics is available 48-96 hours after online publication and is updated daily on week days.
Initial download of the metrics may take a while.