Fig. 9.
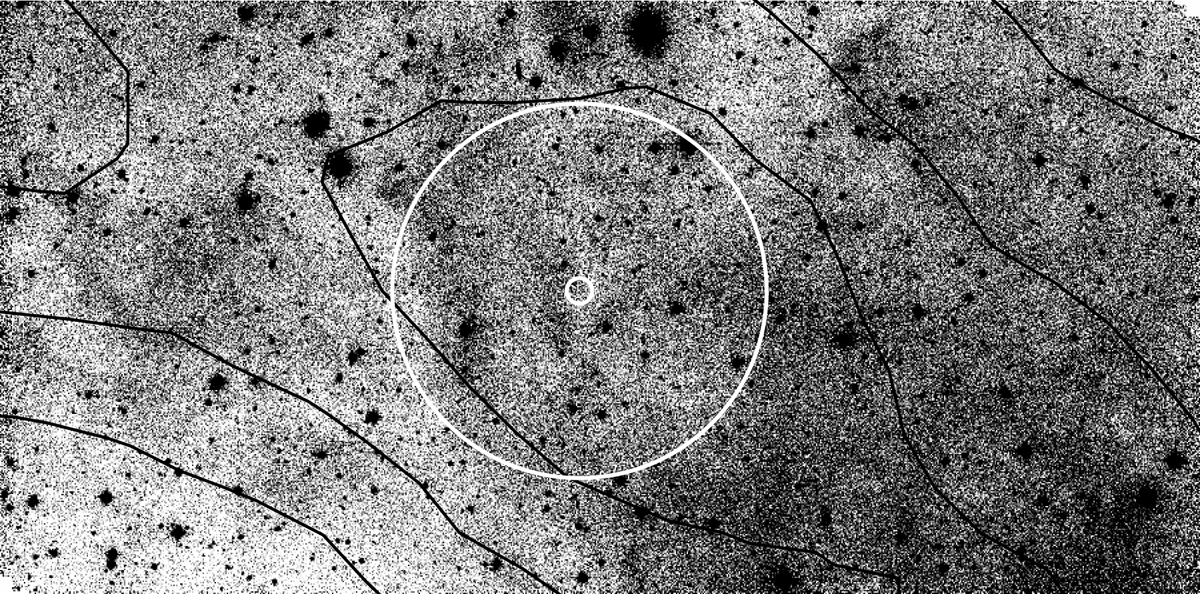
WFC/INT g-band image of the PSZ2 G100.07+17.06. The black contours correspond to the 3, 6, 9 × 10⁻⁶ levels of the Compton y-map in this area. The small and big white circles indicate the nominal Planck position and the 5′ region, respectively. No cluster counterpart is identified in this case. Most probably, the presence of important galactic gas and dust structures influenced the SZ emission in this area, creating spurious enhancements of the SZ signal and, consequently, false SZ detection. We also observe that the elongation and direction of a dust galactic filament is strongly correlated with the observed SZ flux profile, supporting our hypothesis.
Current usage metrics show cumulative count of Article Views (full-text article views including HTML views, PDF and ePub downloads, according to the available data) and Abstracts Views on Vision4Press platform.
Data correspond to usage on the plateform after 2015. The current usage metrics is available 48-96 hours after online publication and is updated daily on week days.
Initial download of the metrics may take a while.