Fig. 2.
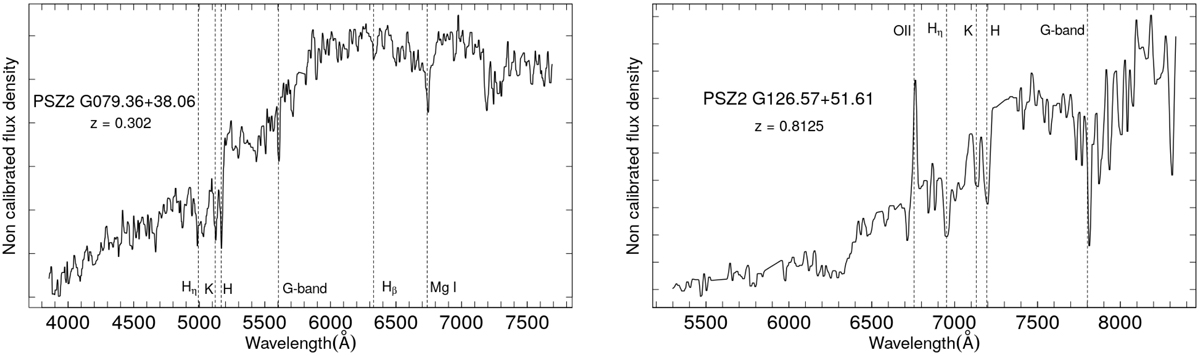
Example of the spectra obtained with TNG/DOLORES (left panel) and GTC/OSIRIS (right panel) for two galaxy members, with magnitudes r′ = 18.7 and 21.8, in the clusters PSZ2 G079.36+38.06 (z = 0.299) and PSZ2 G126.57+51.61 (z = 0.816), respectively. Dashed lines correspond to the wavelength of the absorption features identified in each spectrum at the redshift of the clusters. Flux density is plotted in arbitrary units.
Current usage metrics show cumulative count of Article Views (full-text article views including HTML views, PDF and ePub downloads, according to the available data) and Abstracts Views on Vision4Press platform.
Data correspond to usage on the plateform after 2015. The current usage metrics is available 48-96 hours after online publication and is updated daily on week days.
Initial download of the metrics may take a while.