Fig. C.1.
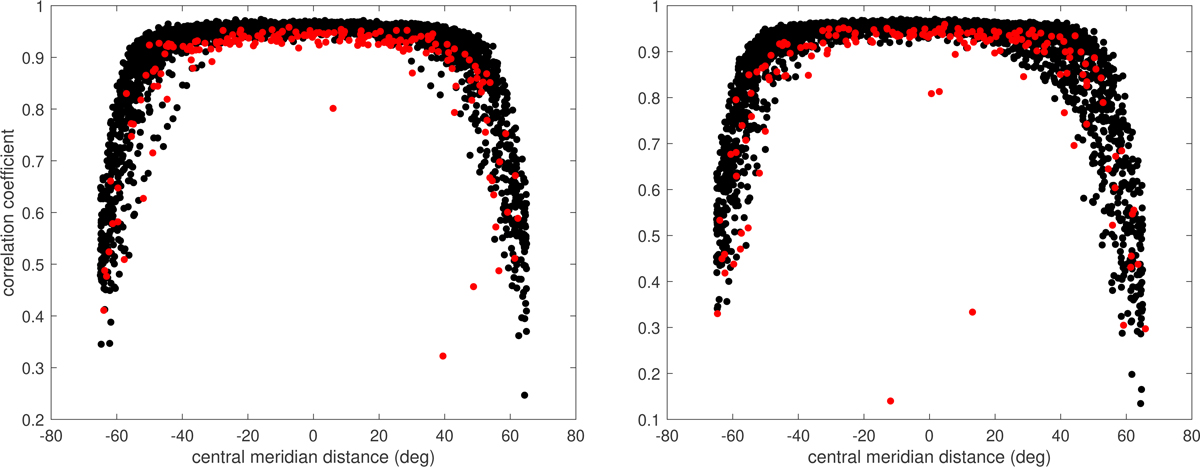
Correlation coefficients for vx and ![]() for quiet Sun (left) and emerging active regions (right) as a function of central meridian distance. Points with a duty cycle above (below) 0.9 are shown in black (red). As described in Sect. 2.1 and Appendix B, large-scale flows were removed by fitting second-order polynomials in x and y.
for quiet Sun (left) and emerging active regions (right) as a function of central meridian distance. Points with a duty cycle above (below) 0.9 are shown in black (red). As described in Sect. 2.1 and Appendix B, large-scale flows were removed by fitting second-order polynomials in x and y.
Current usage metrics show cumulative count of Article Views (full-text article views including HTML views, PDF and ePub downloads, according to the available data) and Abstracts Views on Vision4Press platform.
Data correspond to usage on the plateform after 2015. The current usage metrics is available 48-96 hours after online publication and is updated daily on week days.
Initial download of the metrics may take a while.