Fig. 7.
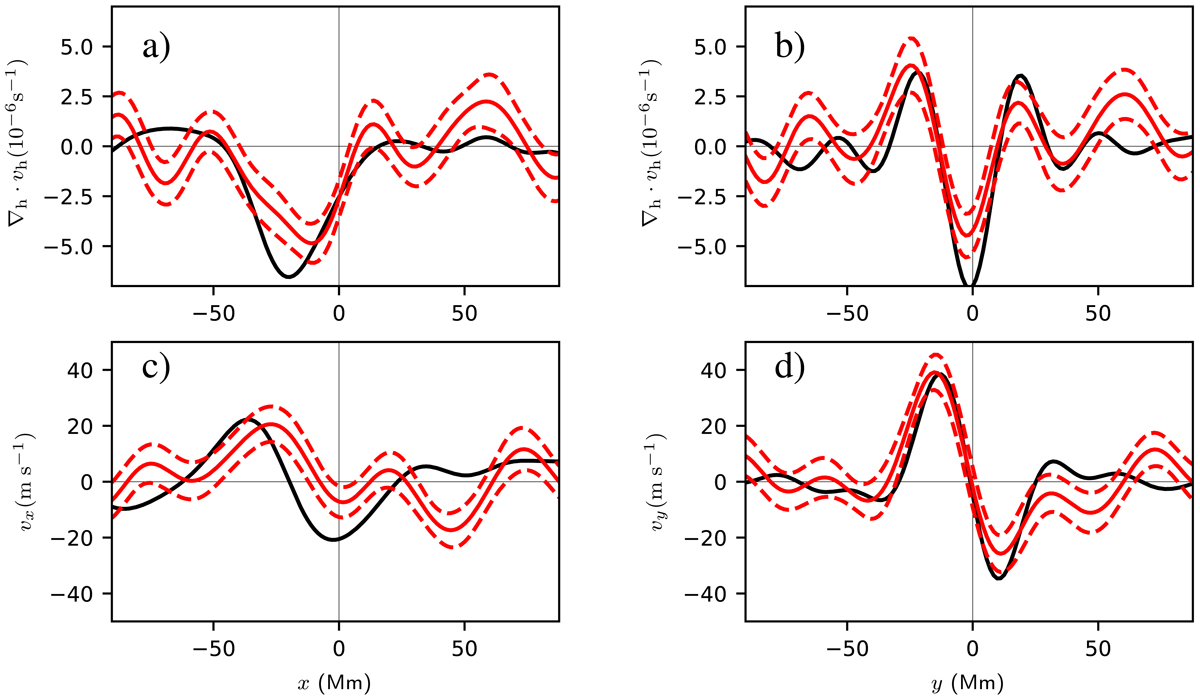
Cuts through the divergence (top row), x component of the velocity (bottom left), and y component of the velocity (bottom right). The red lines show these quantities for averaging over ARs at t = −13.6 h (as in Fig. 4), and the black lines show the corresponding quantities as predicted by the model described in this section. In all panels the divergence or velocity has been averaged in a strip of width 11.1 Mm perpendicular to direction of the cut. The model is a reasonable qualitative explanation of the divergence and y component of velocity. For both the observations and the model, the x component of the flow is weaker than the y component.
Current usage metrics show cumulative count of Article Views (full-text article views including HTML views, PDF and ePub downloads, according to the available data) and Abstracts Views on Vision4Press platform.
Data correspond to usage on the plateform after 2015. The current usage metrics is available 48-96 hours after online publication and is updated daily on week days.
Initial download of the metrics may take a while.