Fig. 5.
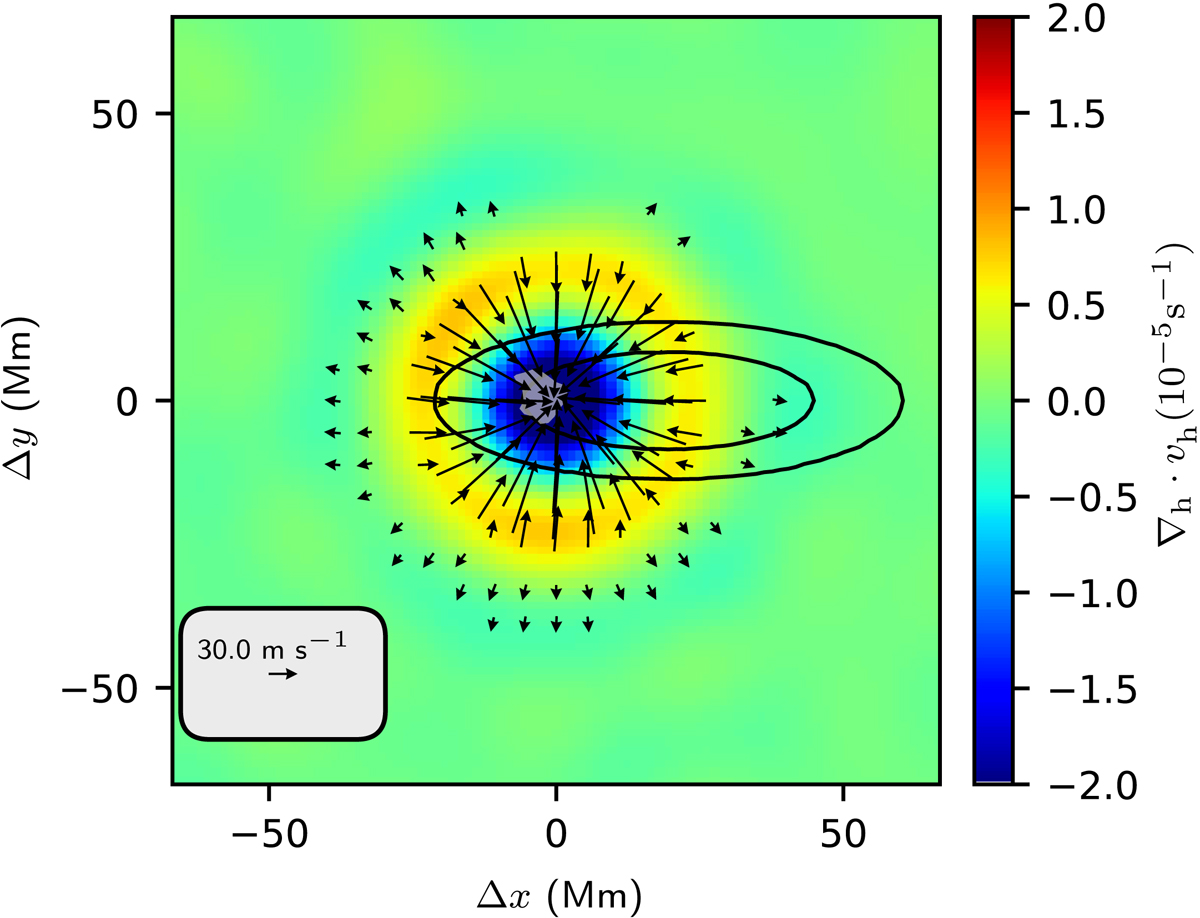
Average over 1129 supergranulation-scale convergence regions and the probability distribution function used to generate synthetic “emergence locations”. These synthetic emergence locations are used in a simple model for the flows at t = −13.6 h before emergence (Fig. 6). The colors in the background show the horizontal divergence (blue for converging flows and red for diverging flows), and the black arrows show the horizontal flow. Flows weaker than 15 m s−1 are not shown. The gray shaded region shows where the average unsigned magnetic field exceeds 10 G. The black curves are the contours of the probability distribution of synthetic emergence locations that enclose 68% and 95% of the probability.
Current usage metrics show cumulative count of Article Views (full-text article views including HTML views, PDF and ePub downloads, according to the available data) and Abstracts Views on Vision4Press platform.
Data correspond to usage on the plateform after 2015. The current usage metrics is available 48-96 hours after online publication and is updated daily on week days.
Initial download of the metrics may take a while.