Fig. 3.
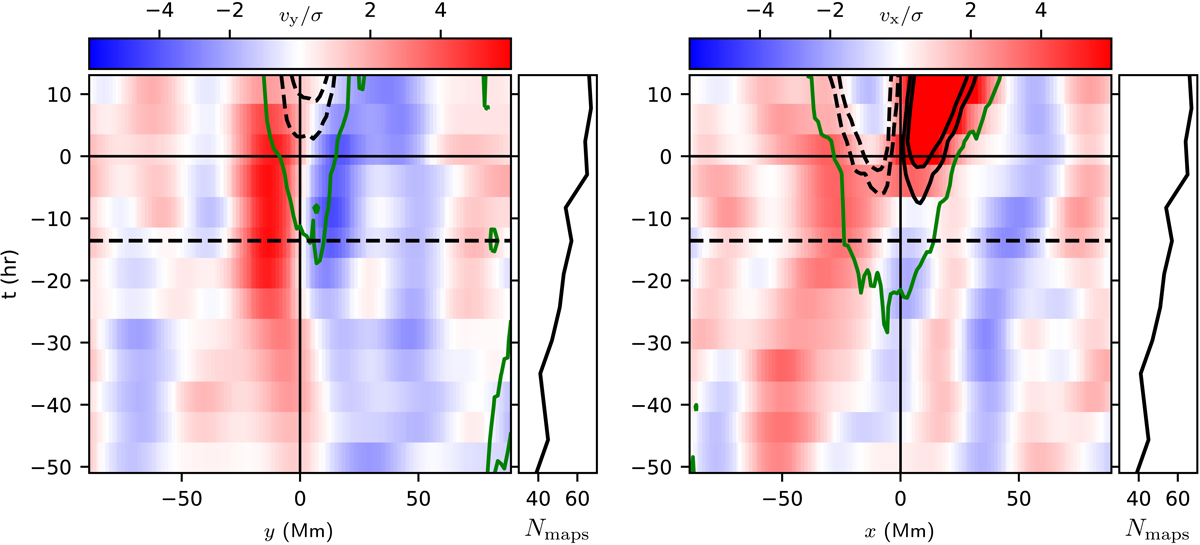
Time evolution of horizontal surface flows after averaging over the AR. Left panel: vy as a function of y after averaging over a strip of half-width 11.1 Mm centered on x = −28 Mm. Right panel: vx as a function of x after averaging over a strip of half-width 11.1 Mm centered on y = 0. The averaging regions are shown as hatched regions in the bottom left panel of Fig. 2. In both cases the velocities are scaled by the error estimated from the scatter observed in the quiet-Sun control regions. The black lines show contours of the average line-of-sight magnetic field, and the dashed line shows negative contours. The spacing between contours is 10 G, and the first contours are at ±20 G. The green lines show 10 G contours of the average unsigned line-of-sight magnetic field. The black dashed lines at t = −13.6 h show the time corresponding to the map shown in the lower left panel of Fig. 2 and also to the slices shown in Fig. 4. The numbers of maps that contribute to the average at each time are shown by the black curves to the right of each panel.
Current usage metrics show cumulative count of Article Views (full-text article views including HTML views, PDF and ePub downloads, according to the available data) and Abstracts Views on Vision4Press platform.
Data correspond to usage on the plateform after 2015. The current usage metrics is available 48-96 hours after online publication and is updated daily on week days.
Initial download of the metrics may take a while.