Fig. 2.
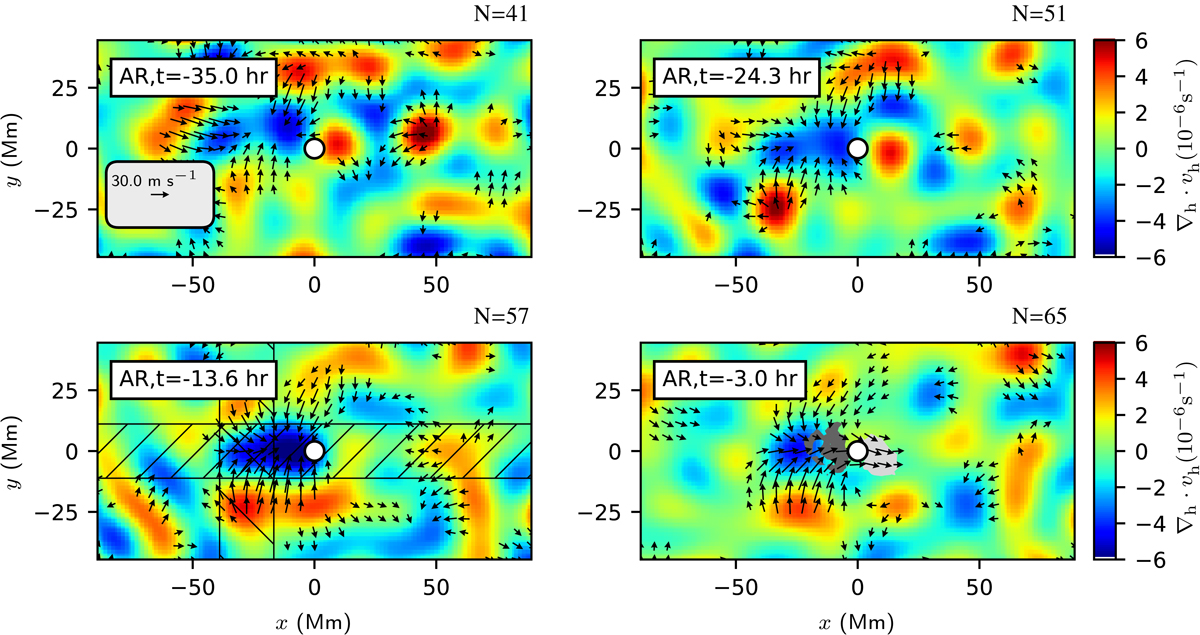
Helioseismology flow maps and magnetograms after averaging over all emerging active regions from Schunker et al. (2016) with a P-factor of two or lower. The small white circle at (x, y) = (0, 0) shows the emergence location. Time increases from 35 h before emergence (top left) to 3 h before emergence (bottom right). The number N of regions contributing to each average map is shown at the top right of each panel. As in Fig. 1, the black arrows show horizontal flows measured from helioseismic holography and the colors show the horizontal divergence (red for diverging flows and blue for converging flows). The gray shaded regions show where the average line-of-sight magnetic field exceeds 30 G (light and dark gray show the two polarities). The scale arrow in the top left panel shows a prograde flow of 30 m s−1; flows weaker than 15 m s−1 are not shown. By 24 h before emergence, an east-west aligned converging flow of about 20 m s−1 is located to the east (retrograde direction) of the emergence location. The hatched regions in the panel for t = −13.6 h show the averaging regions for the cuts shown in Figs. 3 and 4. The noise level varies from about 10 to about 8 m s−1 in the x and y components of the flow as N increases.
Current usage metrics show cumulative count of Article Views (full-text article views including HTML views, PDF and ePub downloads, according to the available data) and Abstracts Views on Vision4Press platform.
Data correspond to usage on the plateform after 2015. The current usage metrics is available 48-96 hours after online publication and is updated daily on week days.
Initial download of the metrics may take a while.