Fig. 3
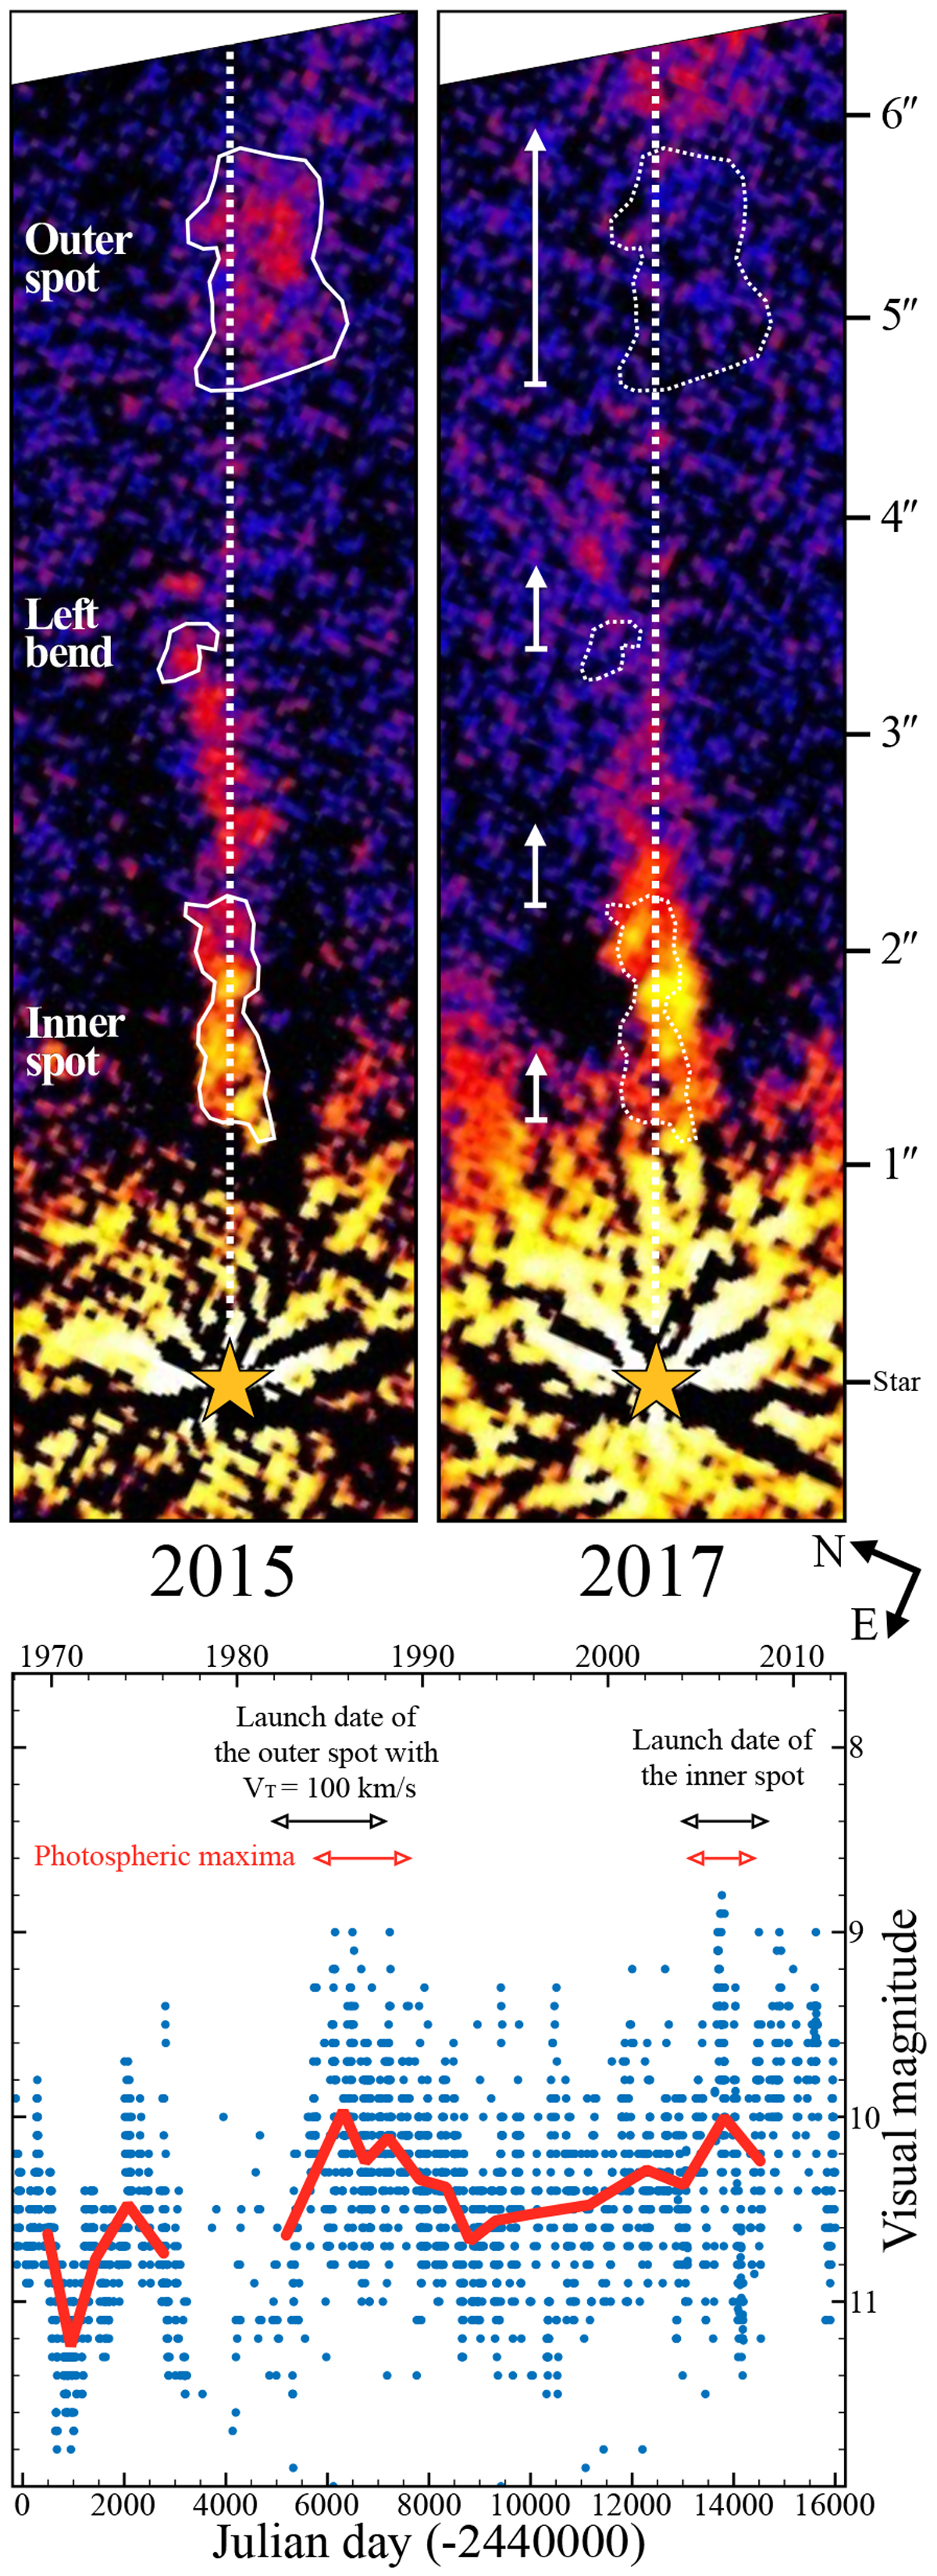
Jet of RY Tau from the H3 images tracing the [Fe II] emission at 1.64 μm from the jet. Top panel: comparison of the jet radial extent between 2015 and 2017. The 2015 features identified in both images are replicated as dashed contours in the 2017 image. The arrows represent their apparent motion. The jet axis (PA = 293°) is indicated by the dashed line. The bright signal in the inner 1′′ is primarily stellar flux residual. Bottom panel: stellar light curve in the last 50 yr. The red line is the best fit to the 3100 blue datapoints. The calculated launch dates of the inner and outer jet spots are indicated by the black arrows, while the red arrows highlight the local photospheric maxima from the curve.
Current usage metrics show cumulative count of Article Views (full-text article views including HTML views, PDF and ePub downloads, according to the available data) and Abstracts Views on Vision4Press platform.
Data correspond to usage on the plateform after 2015. The current usage metrics is available 48-96 hours after online publication and is updated daily on week days.
Initial download of the metrics may take a while.