Fig. 2
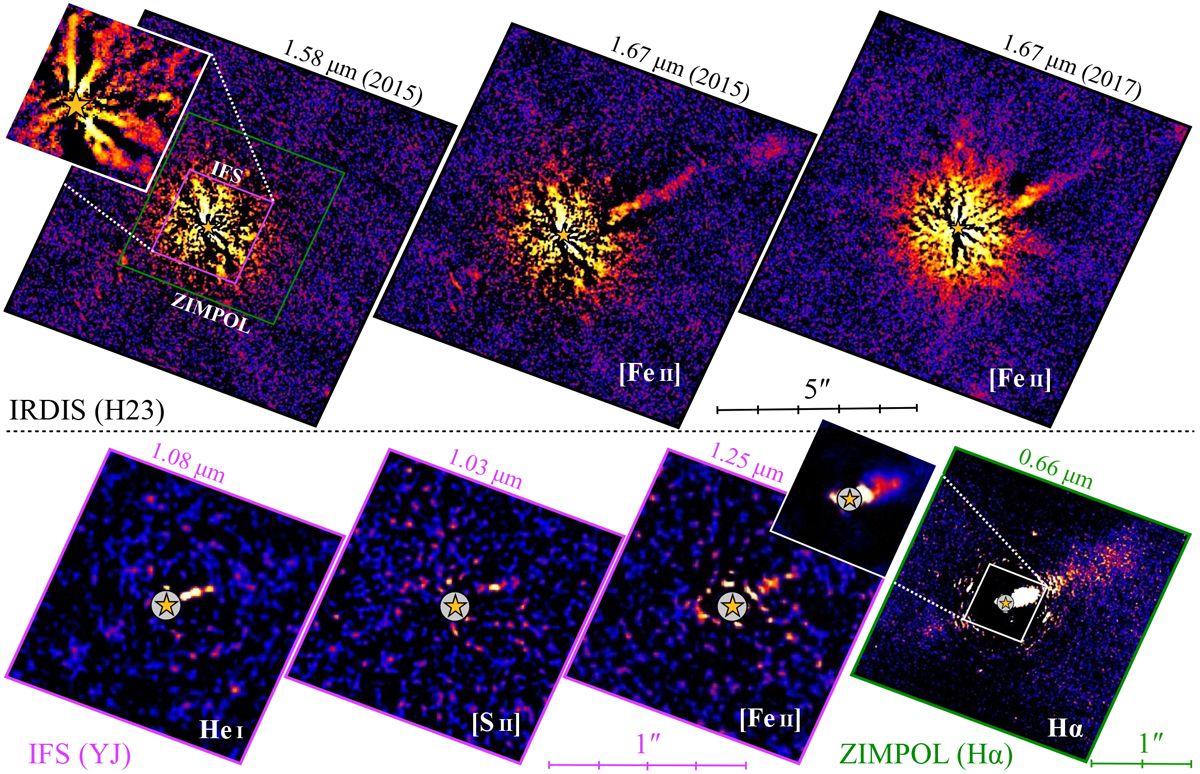
Imagery of the jet of RY Tau from IRDIS (top), IFS (bottom left), and ZIMPOL (bottom right). The first two IRDIS panels are from 2015, with the left one being in the H2 band and the middle one in the H3 band. Right panel: the H3 image taken in 2017. These images are shown in logarithmic scale with the first two only having the same color stretch. IFS panels are specific channels corresponding to λ = 1.08, 1.03, and 1.25 μm, while the ZIMPOL image is in the Hα filter at 0.66 μm. These images have arbitrary linear color stretch. The inset box of the Hα image has adifferent color stretch and a spatial scale corresponding to the IFS images. The violet box in the top left panel corresponds to the field of the IFS images, while the green box corresponds to the field of the main ZIMPOL image. The stellar position is indicated by the symbol. North is up, east is left.
Current usage metrics show cumulative count of Article Views (full-text article views including HTML views, PDF and ePub downloads, according to the available data) and Abstracts Views on Vision4Press platform.
Data correspond to usage on the plateform after 2015. The current usage metrics is available 48-96 hours after online publication and is updated daily on week days.
Initial download of the metrics may take a while.