Fig. 1
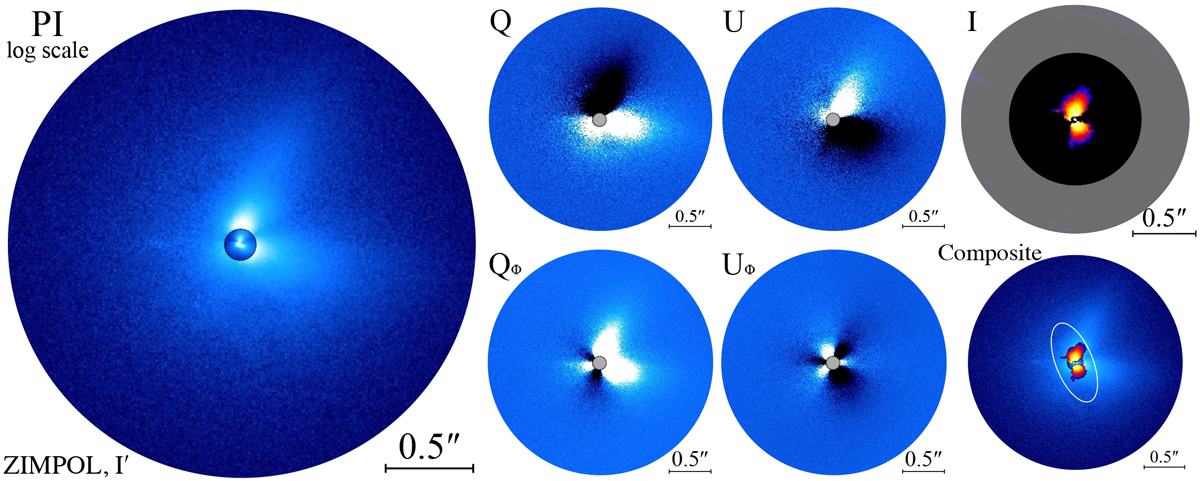
Imagery of RY Tau in the I′ band from ZIMPOL. The polarized intensity PI is shown to the left in logarithmic scale with the main region obtained with coronagraphic SlowPol exposures and the small, inner region with FastPol exposures (see text). The Q, U, Qϕ, and Uϕ parameters are shown in the two central columns with the same linear scale (note the different scale from PI) where black regions indicate negative values. The total intensity image obtained in RDI is shown in logarithmic scale to the top right (the black pixels indicate negative values and the gray mask unreliable results), along with a graphic comparison with PI to the bottom right. The white ellipse outlines the protoplanetary disk seen by ALMA (Long et al. 2018). North is up,east is left.
Current usage metrics show cumulative count of Article Views (full-text article views including HTML views, PDF and ePub downloads, according to the available data) and Abstracts Views on Vision4Press platform.
Data correspond to usage on the plateform after 2015. The current usage metrics is available 48-96 hours after online publication and is updated daily on week days.
Initial download of the metrics may take a while.