Fig. 5
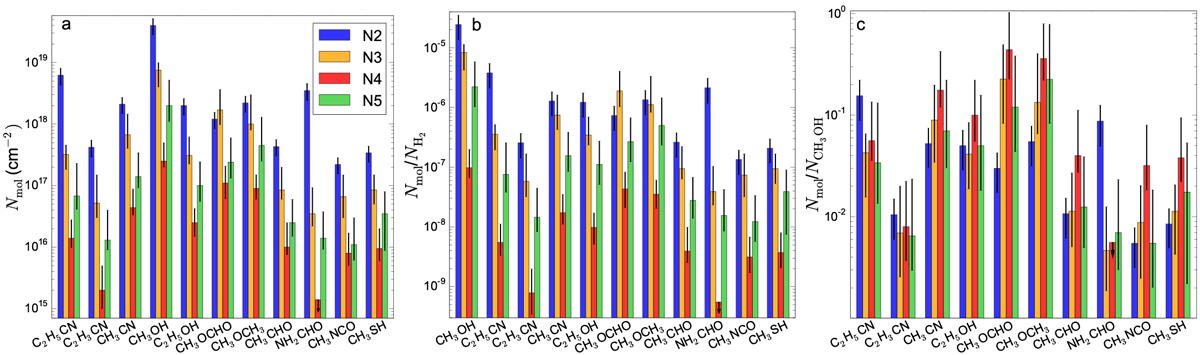
Panel a: column densities of 11 COMs detected toward Sgr B2(N2-N5) (see Table E.2). The error bars show uncertainties on the derived column densities (1σ, see Sect. A). Panel b: chemical abundances relative to H2 of the COMs shown in panel a. The error bars show uncertainties that also include the uncertainty on the H2 column density (1σ, see Sect. 3.1). Panel c: abundances relative to CH3OH of the COMsshown in panel a. The error bars represent 1σ uncertainties on the derived ratios.
Current usage metrics show cumulative count of Article Views (full-text article views including HTML views, PDF and ePub downloads, according to the available data) and Abstracts Views on Vision4Press platform.
Data correspond to usage on the plateform after 2015. The current usage metrics is available 48-96 hours after online publication and is updated daily on week days.
Initial download of the metrics may take a while.