Fig. F.9
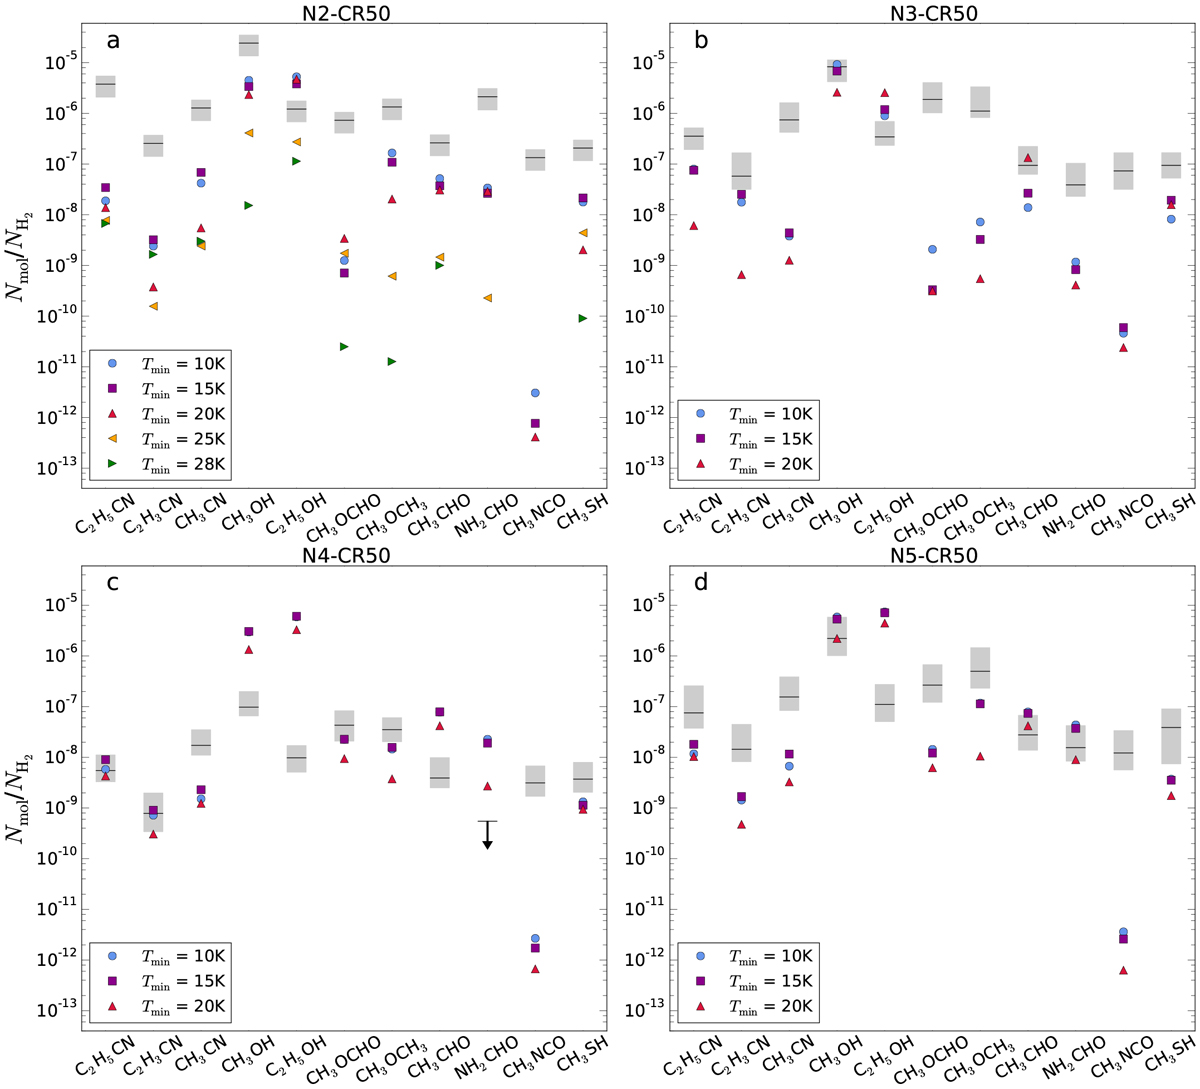
Abundances of 11 COMs with respect to H2 for models N2-CR50 (a), N3-CR50 (b), N4-CR50 (c), and N5-CR50 (d). In each panel the different symbols indicate the abundances calculated at T = 150 K for different minimum dust temperatures. In each panel the horizontal black lines show the observed abundances relative to H2 (Table E.3). The gray boxes show the 1σ uncertainties. The arrow indicates an upper limit. In panel a the chemical abundances lower than 4 × 10⁻¹⁴ are not visible.
Current usage metrics show cumulative count of Article Views (full-text article views including HTML views, PDF and ePub downloads, according to the available data) and Abstracts Views on Vision4Press platform.
Data correspond to usage on the plateform after 2015. The current usage metrics is available 48-96 hours after online publication and is updated daily on week days.
Initial download of the metrics may take a while.