Open Access
Fig. F.8
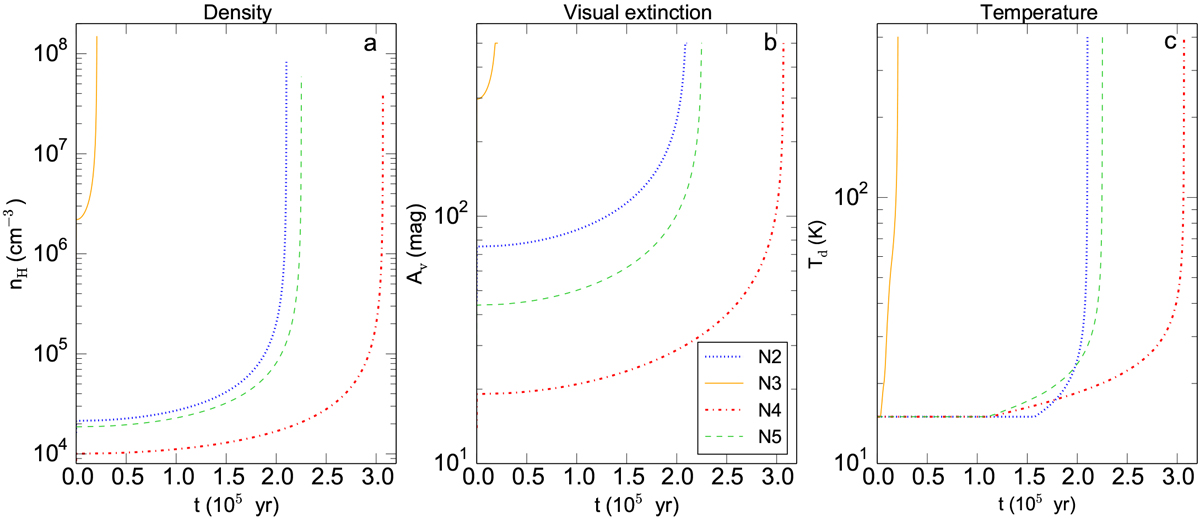
Panel a: gas densities as a function of time along the trajectory of a parcel of gas gradually infalling through the envelope of Sgr B2(N2-N5) (see also Fig. F.5). Panel b: same as (a) for the visual extinction. Panel c: same as (a) for the dust temperature for Tmin = 15 K, up to Tmax = 400 K.
Current usage metrics show cumulative count of Article Views (full-text article views including HTML views, PDF and ePub downloads, according to the available data) and Abstracts Views on Vision4Press platform.
Data correspond to usage on the plateform after 2015. The current usage metrics is available 48-96 hours after online publication and is updated daily on week days.
Initial download of the metrics may take a while.