Fig. F.7
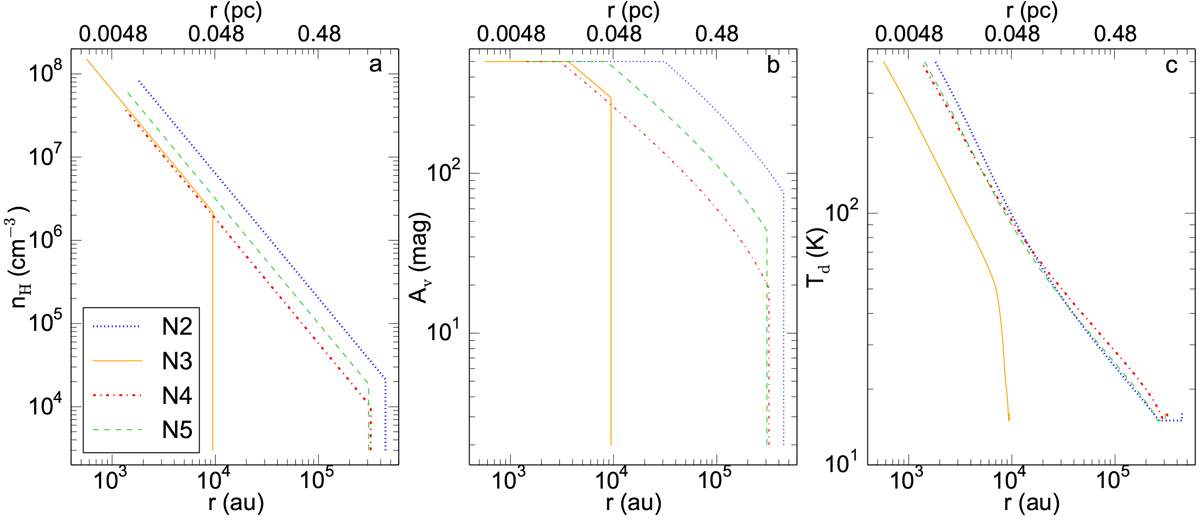
Panel a: gas densities along the trajectory of a parcel of gas gradually infalling through the envelopes of Sgr B2(N2-N5). The quasi-static contraction phase is characterized by the density increasing over time at a constant radius (Fig. F.4a). The subsequent free-fall collapse phase assumes a density distribution propotional to r−1.5. Panel b: visual extinction calculated as a function of the density along the trajectory of a parcel of gas gradually infalling through the envelope. The quasi-static contraction phase is characterized by the extinction increasing over time at a constant radius (Fig. F.4b). During the free-fall collapse phase the extinction increases with the density (Eq. (16)) until Av-max = 500 mag. Panel c: temperature evolution along the trajectory of a parcel of gas gradually infalling through the envelope (see also Fig. F.6). The evolution of the temperature during the quasi-static contraction phase is shown for a minimum temperature Tmin = 15 K (see Fig. 4).
Current usage metrics show cumulative count of Article Views (full-text article views including HTML views, PDF and ePub downloads, according to the available data) and Abstracts Views on Vision4Press platform.
Data correspond to usage on the plateform after 2015. The current usage metrics is available 48-96 hours after online publication and is updated daily on week days.
Initial download of the metrics may take a while.