Fig. F.6
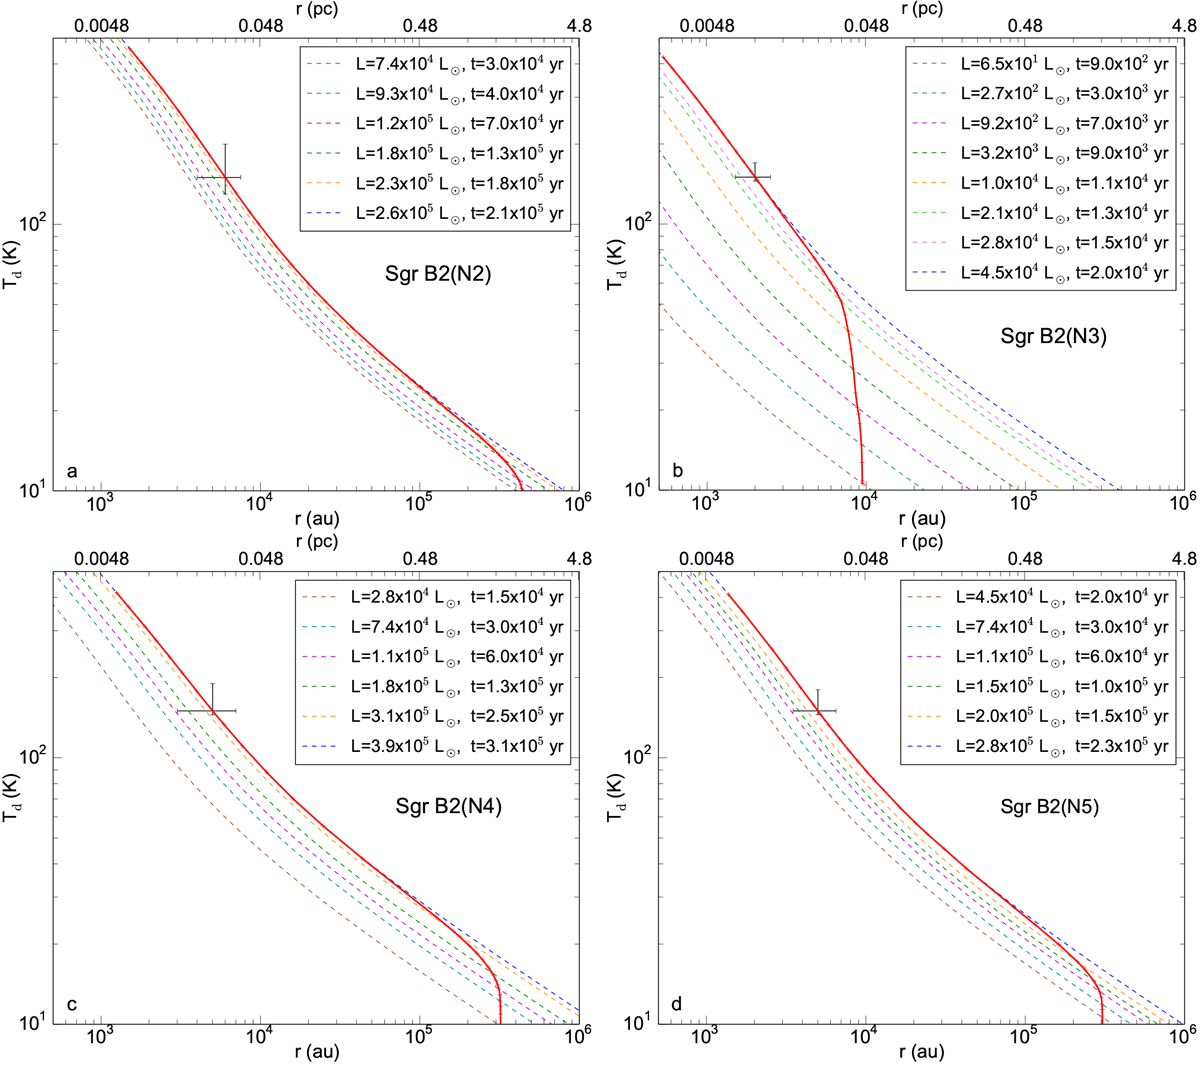
Dust temperature evolution along the trajectory of a parcel of gas infalling toward the central protostar during the free-fall collapse phase for Sgr B2(N2-N5) (red line). In each panel the dashed lines show the dust temperature profiles computed using RADMC-3D with different luminosities (that is at different evolutionary stages). They show how the dust temperature at a given radius in the envelope of each source increases as the total luminosity of the central protostar rises with time (as indicated in the upper right corner). The observational constraint, Td (r0) = T0, used to derive the current luminosity of the source is plotted with errorbars (1σ).
Current usage metrics show cumulative count of Article Views (full-text article views including HTML views, PDF and ePub downloads, according to the available data) and Abstracts Views on Vision4Press platform.
Data correspond to usage on the plateform after 2015. The current usage metrics is available 48-96 hours after online publication and is updated daily on week days.
Initial download of the metrics may take a while.