Fig. 3
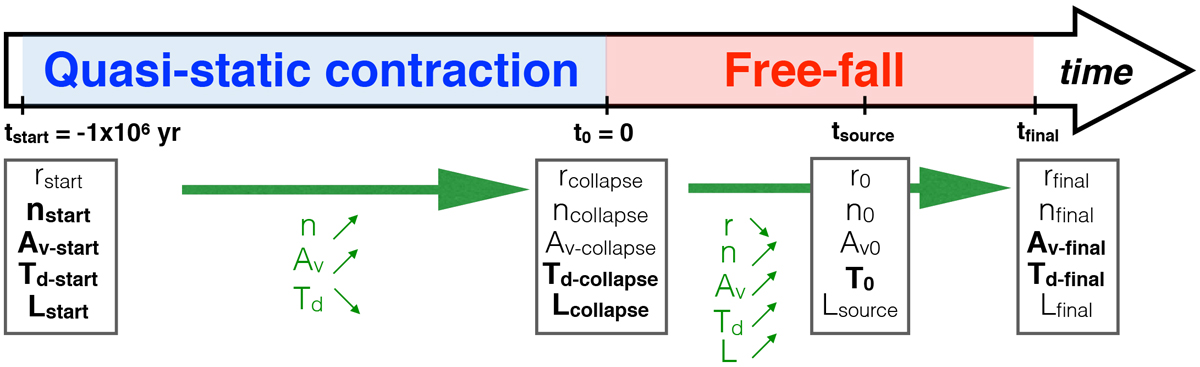
Two-stage physical model assumed for the time evolution of Sgr B2(N2-N5). The physical properties derived at the boundaries of each stage are shown in boxes (see also Table 2). The parameters that are common to all sources are highlighted in boldface. The evolution of the physical parameters during each stage is indicated in green with arrows. The evolution of Td during the first stage depends on the adopted minimum dust temperature (see Sect. 3.5.1).
Current usage metrics show cumulative count of Article Views (full-text article views including HTML views, PDF and ePub downloads, according to the available data) and Abstracts Views on Vision4Press platform.
Data correspond to usage on the plateform after 2015. The current usage metrics is available 48-96 hours after online publication and is updated daily on week days.
Initial download of the metrics may take a while.