Fig. D.1
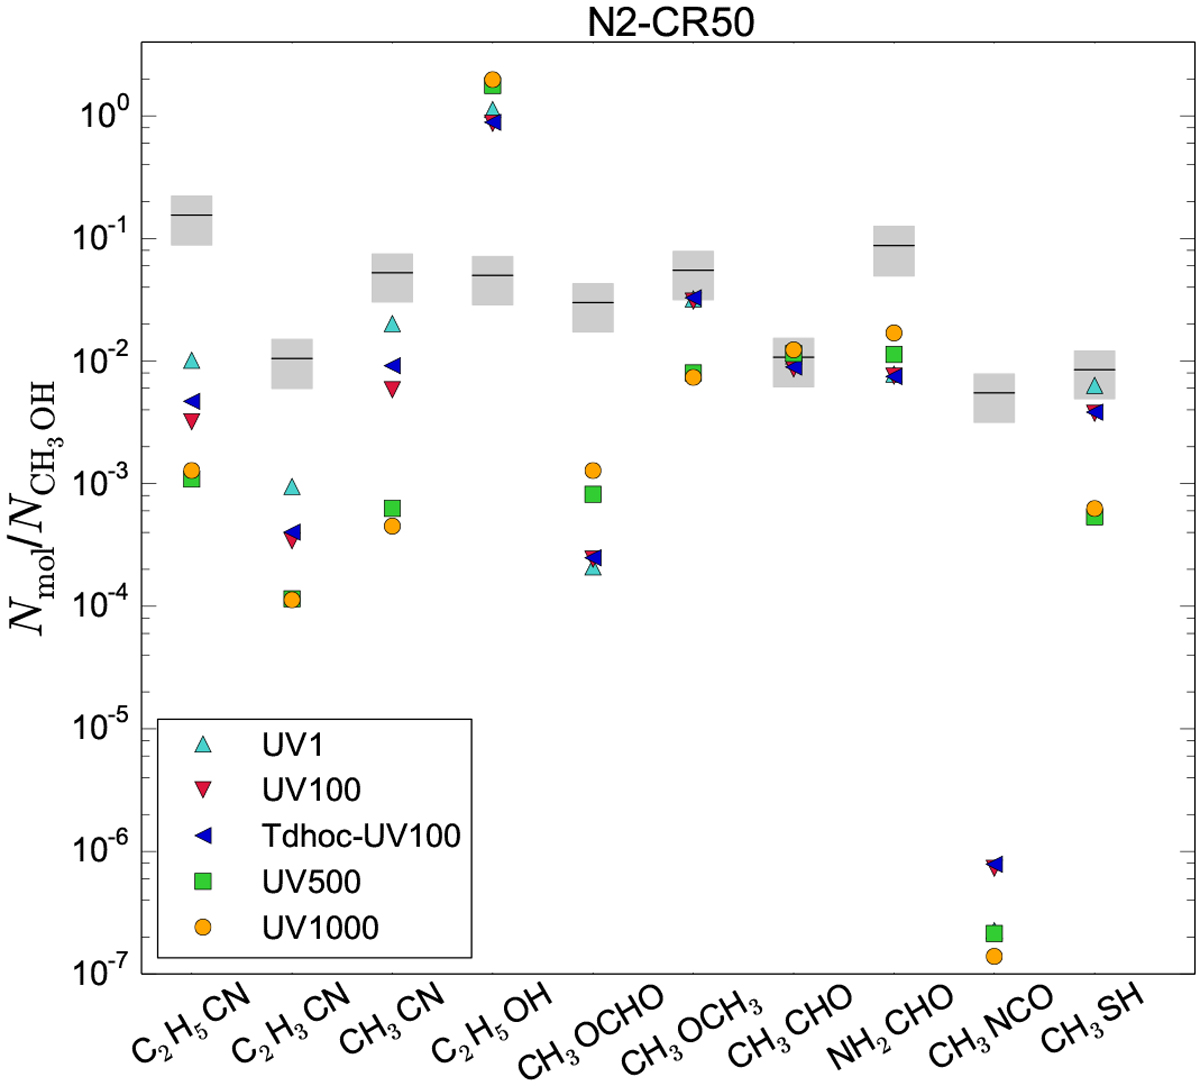
Chemical abundances with respect to CH3OH of ten COMscalculated at T = 150 K by the models N2-CR50. The different symbols indicate the abundances calculated with different χUV. Model Tdhoc-UV100 shows the results obtained using the dust temperature expression given by Hocuk (2017) with χUV = 100. The horizontal black lines show the observed abundances relative to CH3OH. The gray boxes represent the 1σ uncertainties.
Current usage metrics show cumulative count of Article Views (full-text article views including HTML views, PDF and ePub downloads, according to the available data) and Abstracts Views on Vision4Press platform.
Data correspond to usage on the plateform after 2015. The current usage metrics is available 48-96 hours after online publication and is updated daily on week days.
Initial download of the metrics may take a while.