Fig. 2
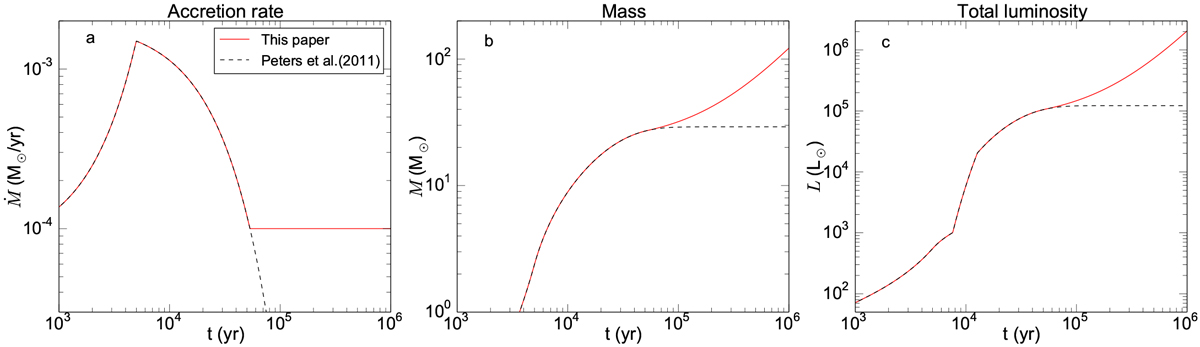
Panela: accretion rate evolution for a young high-mass protostar approximated from the RMHD simulations of Peters et al. (2011; dashed lines). Panel b: time evolution of the protostar’s mass derived from its accretion rate, Ṁ (t) (panel a, dashed line). Panel c: time evolution of the protostar’s total luminosity derived from its mass, M (t) (panel b, dashed line), using the Hosokawa & Omukai (2009) mass-luminosity relation (Fig. F.3). Inall panels the solid line shows the result obtained when keeping a constant accretion rate (10−4 M⊙ yr−1) after ~6 × 10⁴ yr.
Current usage metrics show cumulative count of Article Views (full-text article views including HTML views, PDF and ePub downloads, according to the available data) and Abstracts Views on Vision4Press platform.
Data correspond to usage on the plateform after 2015. The current usage metrics is available 48-96 hours after online publication and is updated daily on week days.
Initial download of the metrics may take a while.