Fig. B.2
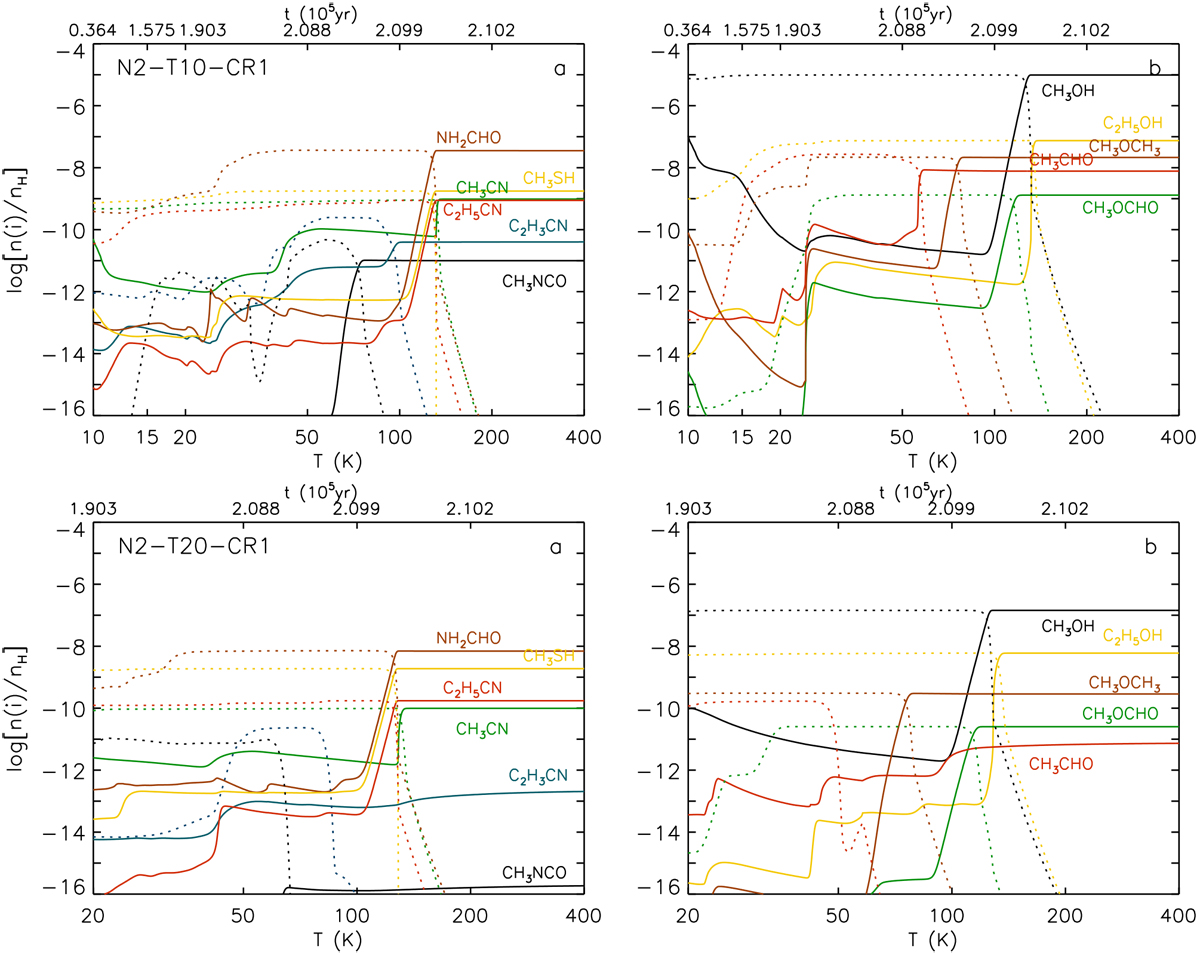
Calculated fractional abundances of 11 COMs for models N2-T10-CR1 (top panels) and N2-T20-CR1 (bottom panels), plotted as a function of temperature in the envelope of Sgr B2(N2) during the free-fall collapse phase. In each panel the timescale shown at the top is derived from the time-dependent evolution of the temperature along the trajectory of the infalling parcel of gas (see Sect. 3.5.2). In each panel, the solid lines show the fractional abundances (with respect to total hydrogen) in the gas phase while the dotted lines show the abundances of the same species on the grains (ice-surface+mantle).
Current usage metrics show cumulative count of Article Views (full-text article views including HTML views, PDF and ePub downloads, according to the available data) and Abstracts Views on Vision4Press platform.
Data correspond to usage on the plateform after 2015. The current usage metrics is available 48-96 hours after online publication and is updated daily on week days.
Initial download of the metrics may take a while.