Fig. 16
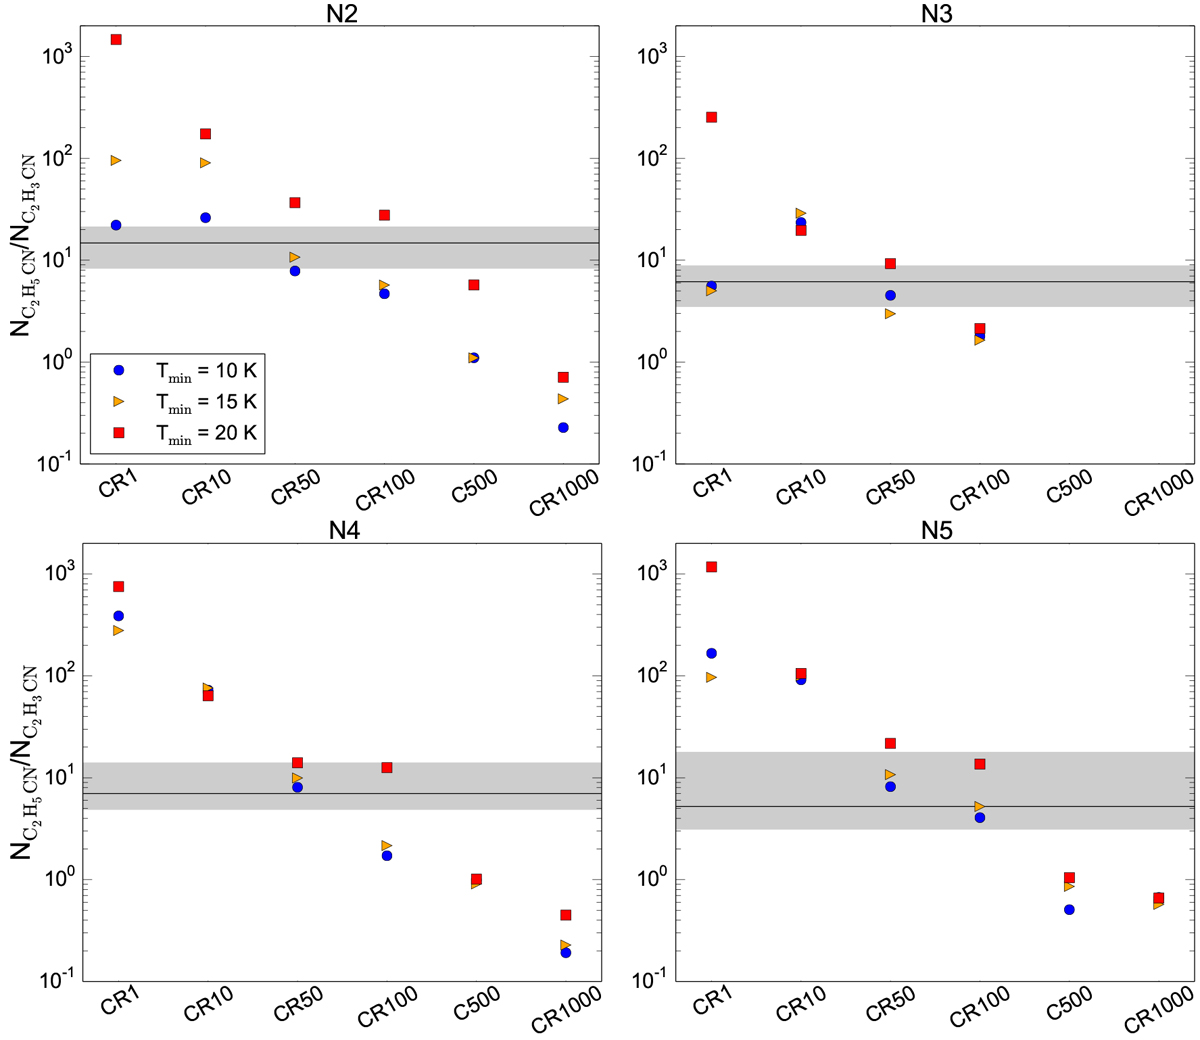
Calculated fractional abundances of C2H5CN with respect to C2H3CN as a function of the CRIR. In each panel, the different symbols indicate the abundances calculated at T = 150 K for different minimum dust temperatures and the horizontal black line shows the observed ratio. Uncertainties (1σ) are shown in gray. The [C2H5CN]/[C2H3CN] ratios obtained for models N3-CR500 ad N3-CR1000 (<10−2) are not displayed.
Current usage metrics show cumulative count of Article Views (full-text article views including HTML views, PDF and ePub downloads, according to the available data) and Abstracts Views on Vision4Press platform.
Data correspond to usage on the plateform after 2015. The current usage metrics is available 48-96 hours after online publication and is updated daily on week days.
Initial download of the metrics may take a while.