Fig. 13
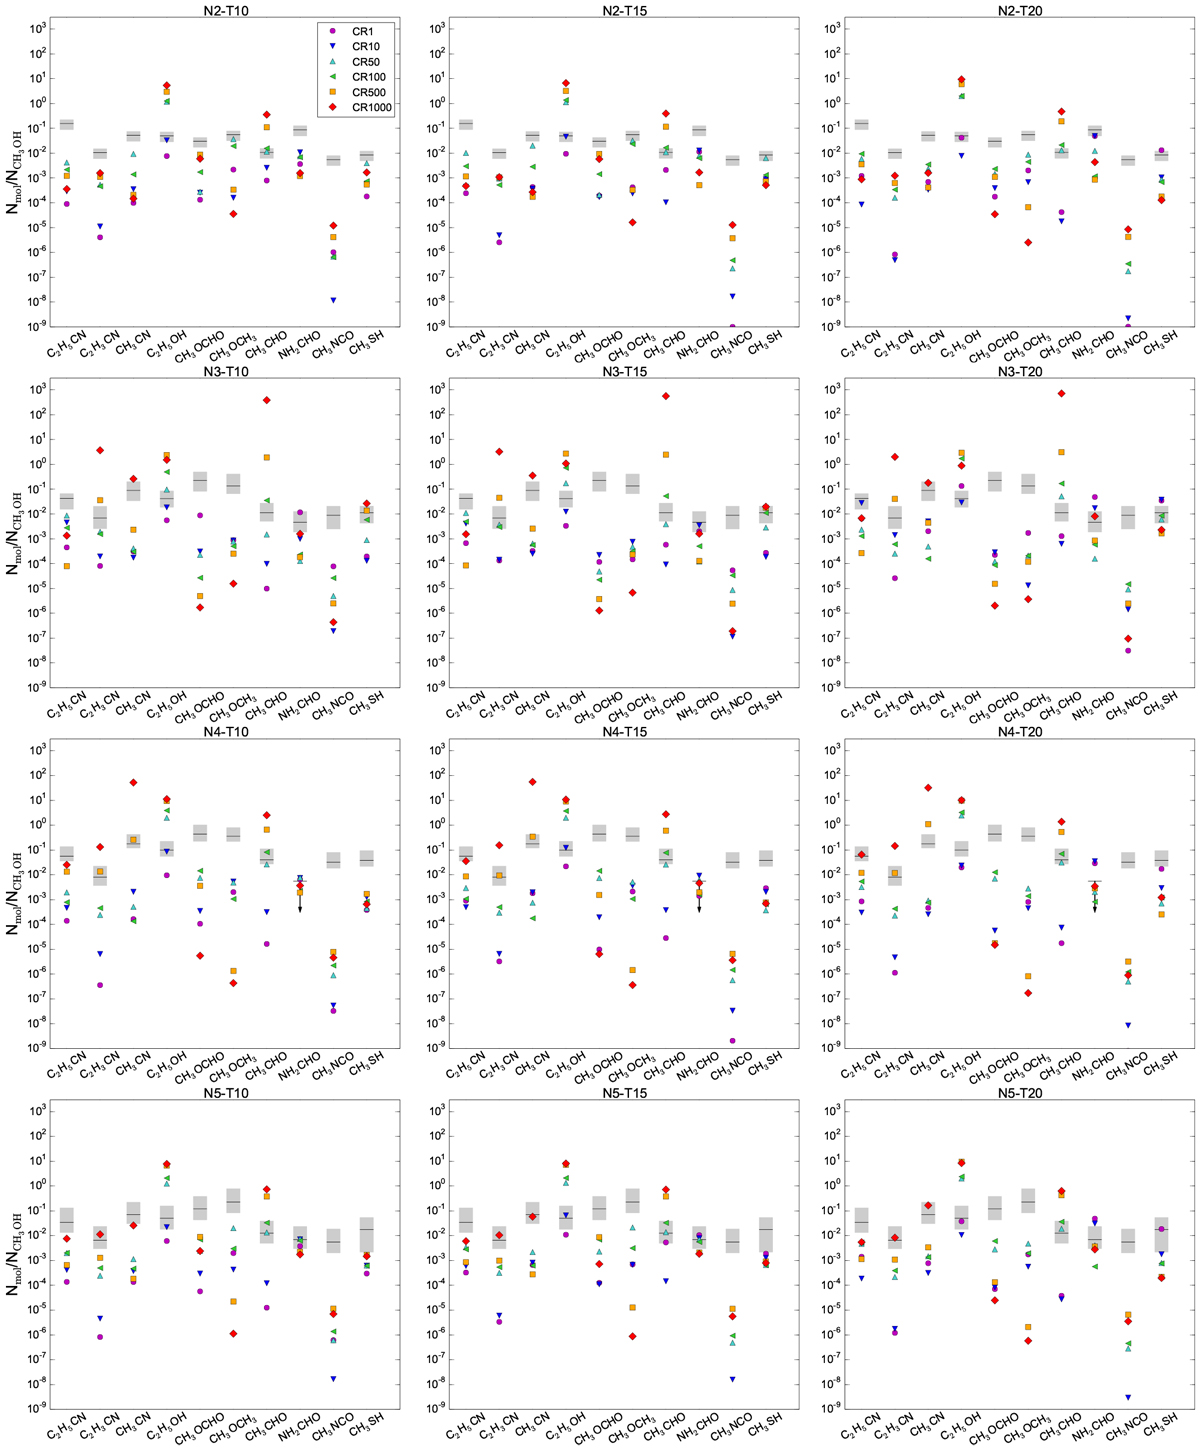
From top to bottom: abundances of ten COMs with respect to CH3OH calculated atT = 150 K by the models N2-N5, with different Tmin. In each panel the different symbols indicate the abundances calculated with different CRIR values. The horizontal black lines show the observed abundances relative to CH3OH. The gray boxes represent the 1σ uncertainties. Arrows indicate upper limits. The abundances relative to CH3OH lower than 10−9 are not visible in the plots.
Current usage metrics show cumulative count of Article Views (full-text article views including HTML views, PDF and ePub downloads, according to the available data) and Abstracts Views on Vision4Press platform.
Data correspond to usage on the plateform after 2015. The current usage metrics is available 48-96 hours after online publication and is updated daily on week days.
Initial download of the metrics may take a while.