Fig. 12
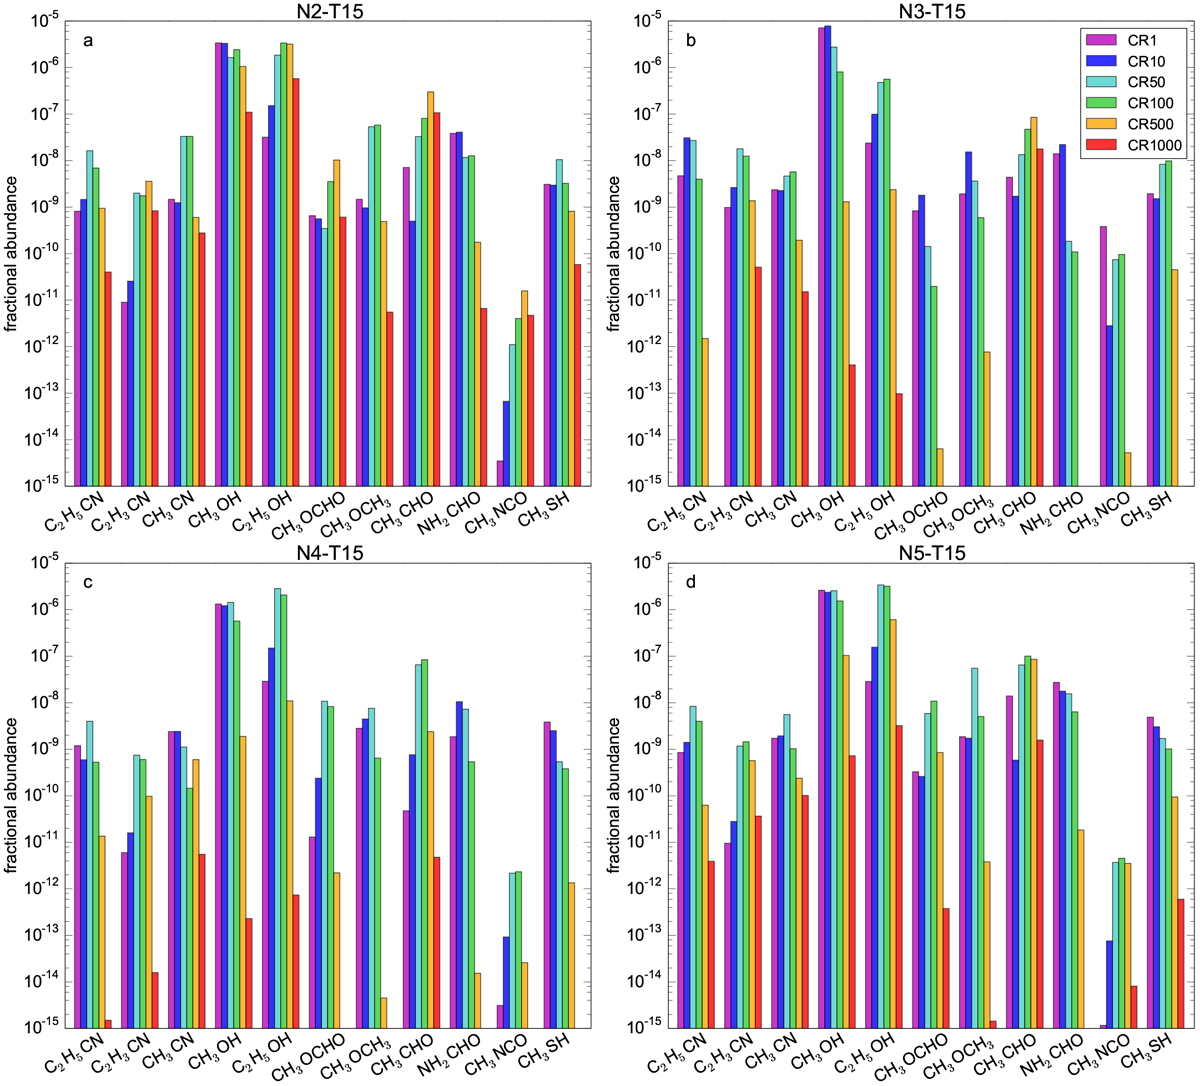
Calculated gas-phase fractional abundances (with respect to total hydrogen) of 11 COMs obtained at the end of the simulations for model N2-T15 (panel a), N3-T15 (panel b), N4-T15 (panel c), and N5-T15 (panel d), with different CRIR values as shown in Table 3. Species with fractional abundances lower than 10−15 are not visible in the histograms.
Current usage metrics show cumulative count of Article Views (full-text article views including HTML views, PDF and ePub downloads, according to the available data) and Abstracts Views on Vision4Press platform.
Data correspond to usage on the plateform after 2015. The current usage metrics is available 48-96 hours after online publication and is updated daily on week days.
Initial download of the metrics may take a while.