Fig. 8.
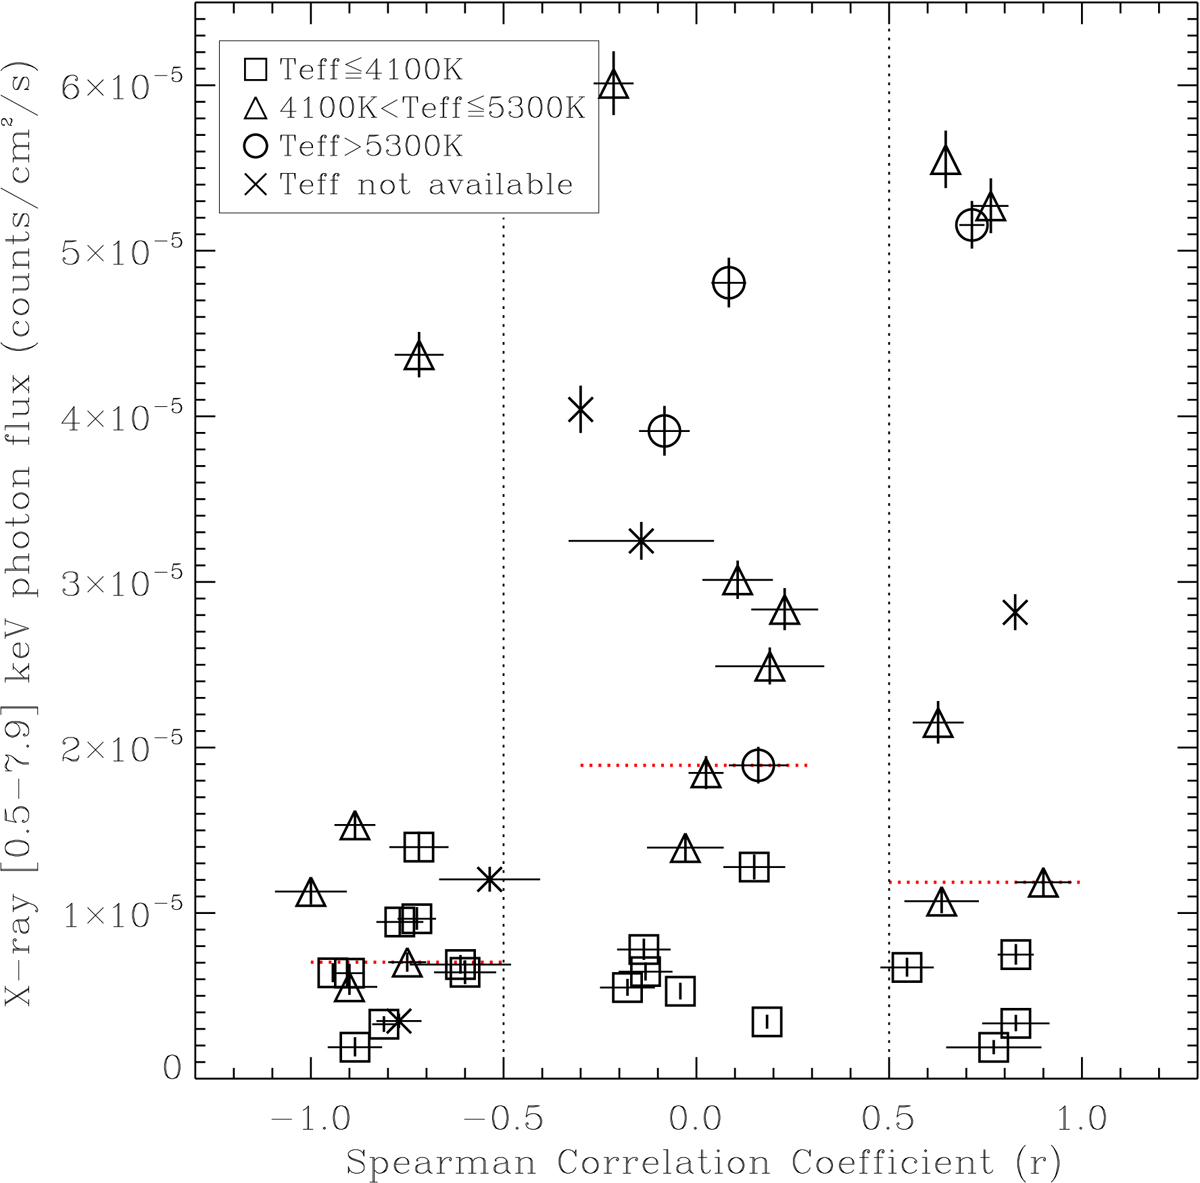
X-ray photon flux vs. the Spearman’s correlation coefficient. Different symbols are used to mark stars in three different ranges of Teff, as shown in the label. The vertical lines delimit the locus of the anti-correlated and correlated groups. The horizontal dotted lines instead mark the median values of photon flux in the three groups. not correlated stars have on average larger X-ray luminosity than the stars in the other two samples.
Current usage metrics show cumulative count of Article Views (full-text article views including HTML views, PDF and ePub downloads, according to the available data) and Abstracts Views on Vision4Press platform.
Data correspond to usage on the plateform after 2015. The current usage metrics is available 48-96 hours after online publication and is updated daily on week days.
Initial download of the metrics may take a while.