Fig. 7.
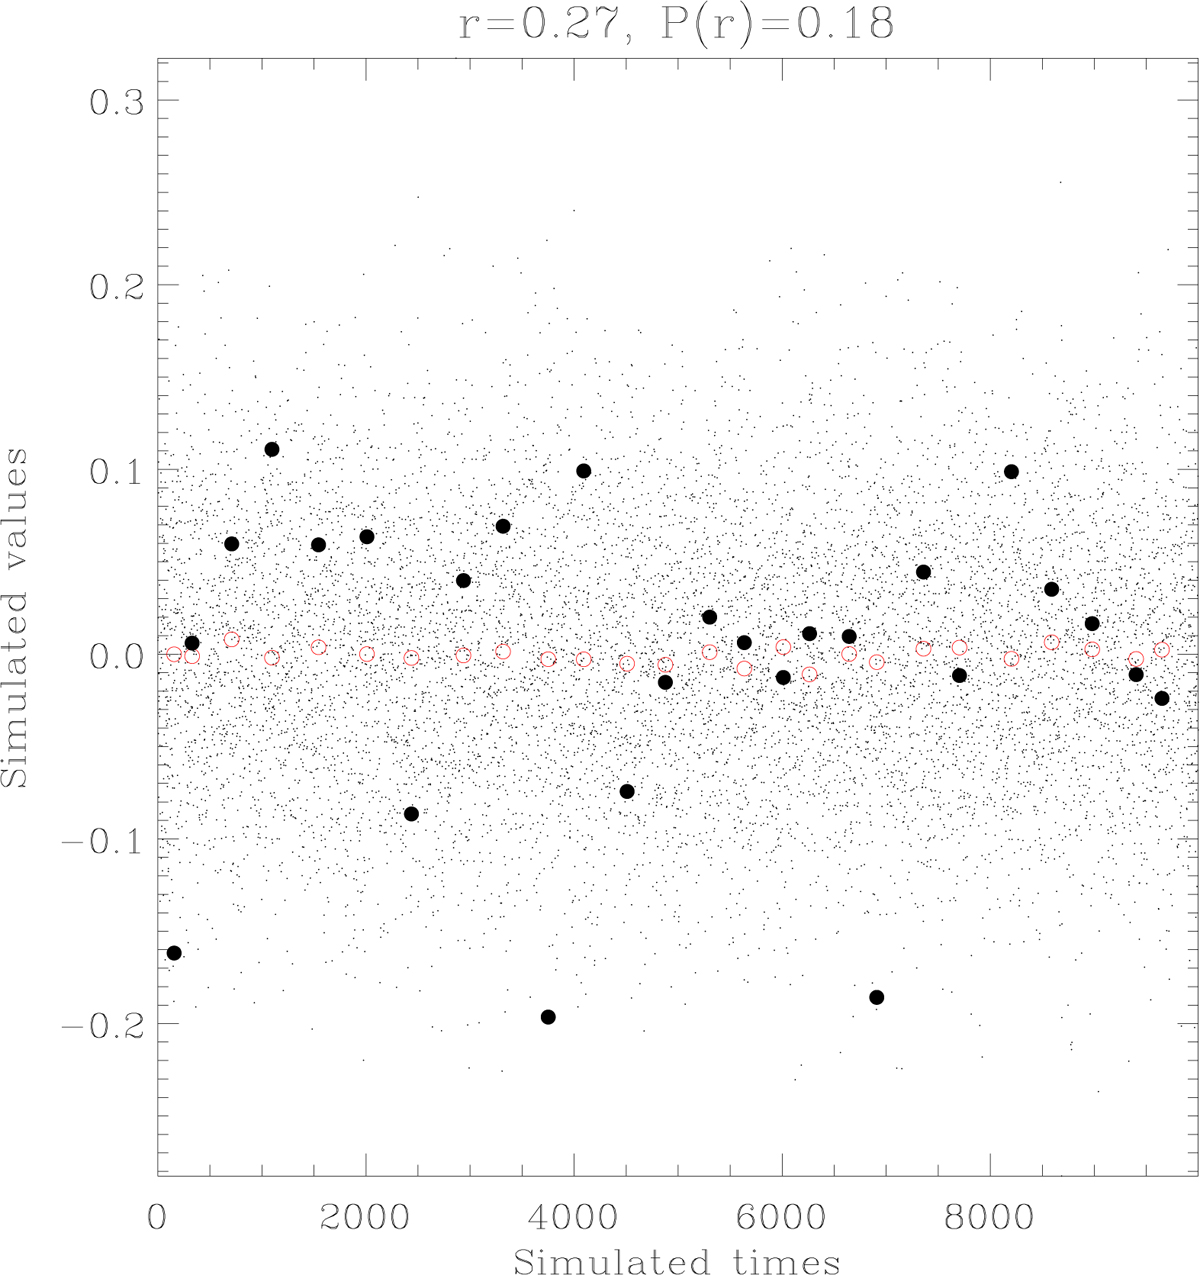
Example of a simulated random light curve. The small points represent the 10 000 random numbers, normally distributed around zero, used to simulate the random optical variability; the empty red circles mark the sampled curve obtained from these numbers; the filled circles marked the sampled curve obtained from 340 points randomly distributed between 0 and 10 000. The results of the Spearman correlation test are shown above the panel.
Current usage metrics show cumulative count of Article Views (full-text article views including HTML views, PDF and ePub downloads, according to the available data) and Abstracts Views on Vision4Press platform.
Data correspond to usage on the plateform after 2015. The current usage metrics is available 48-96 hours after online publication and is updated daily on week days.
Initial download of the metrics may take a while.