Fig. 6.
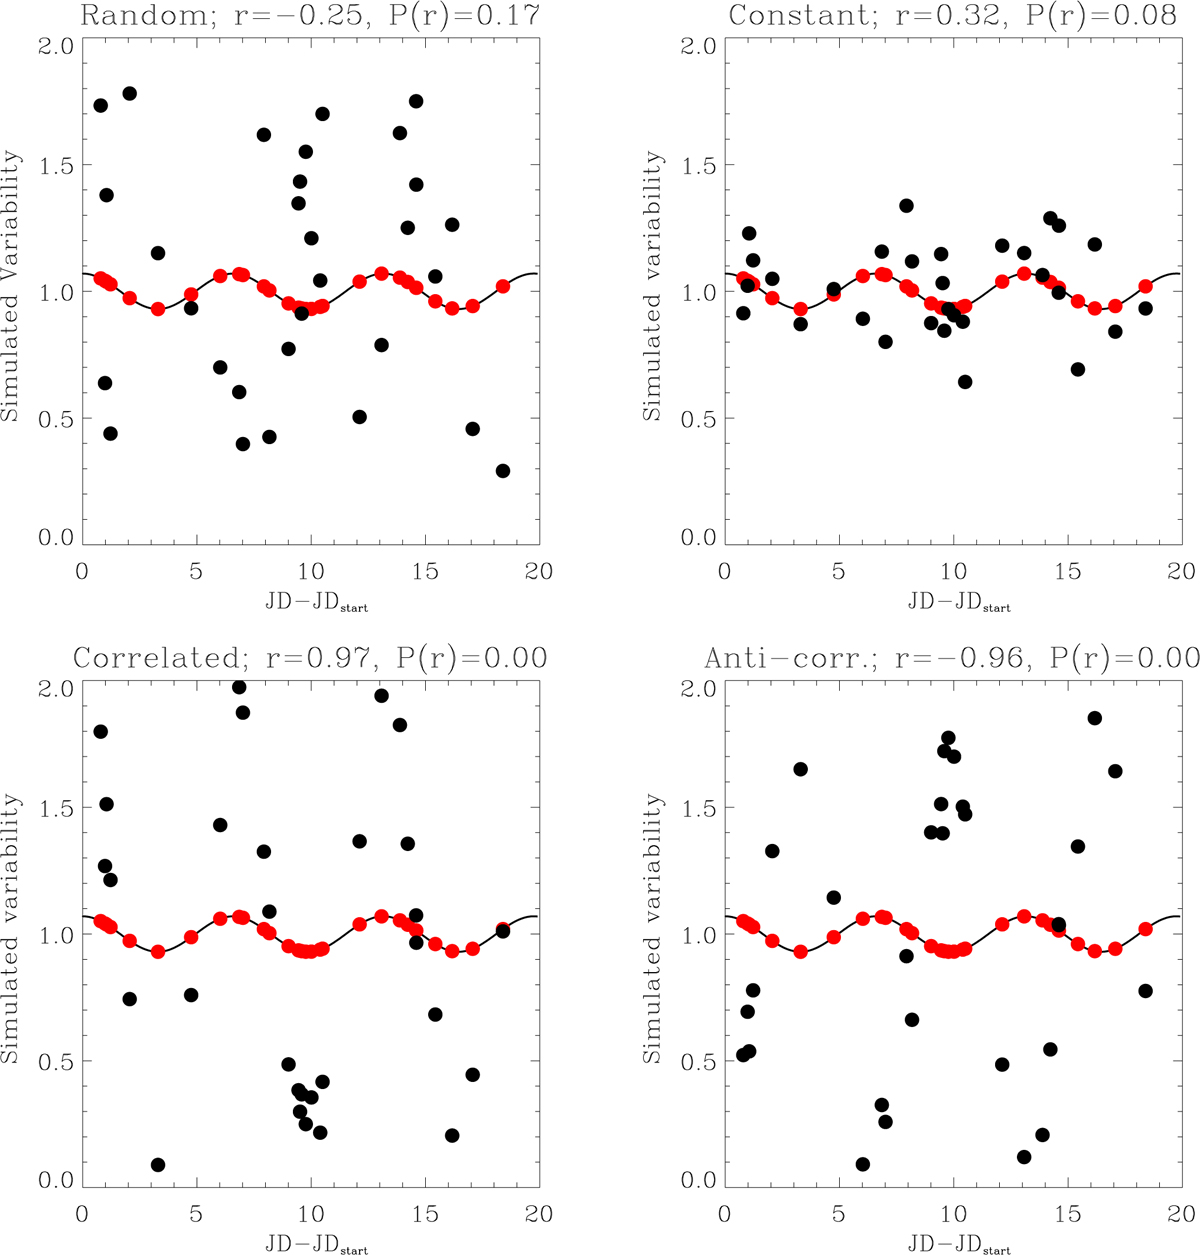
Correlation tests between a sinusoid with three cycles in 20 days and a random (upper left panel), constant (upper right panel), correlated (bottom left panel), and anti-correlated (bottom right panel) simulated X-ray light curve. The red points show how the sinusoid is sampled, and the black points mark the simulated X-ray photon fluxes. The results of the Spearman two-ranks correlation test are shown above each panel.
Current usage metrics show cumulative count of Article Views (full-text article views including HTML views, PDF and ePub downloads, according to the available data) and Abstracts Views on Vision4Press platform.
Data correspond to usage on the plateform after 2015. The current usage metrics is available 48-96 hours after online publication and is updated daily on week days.
Initial download of the metrics may take a while.