Free Access
Fig. 5.
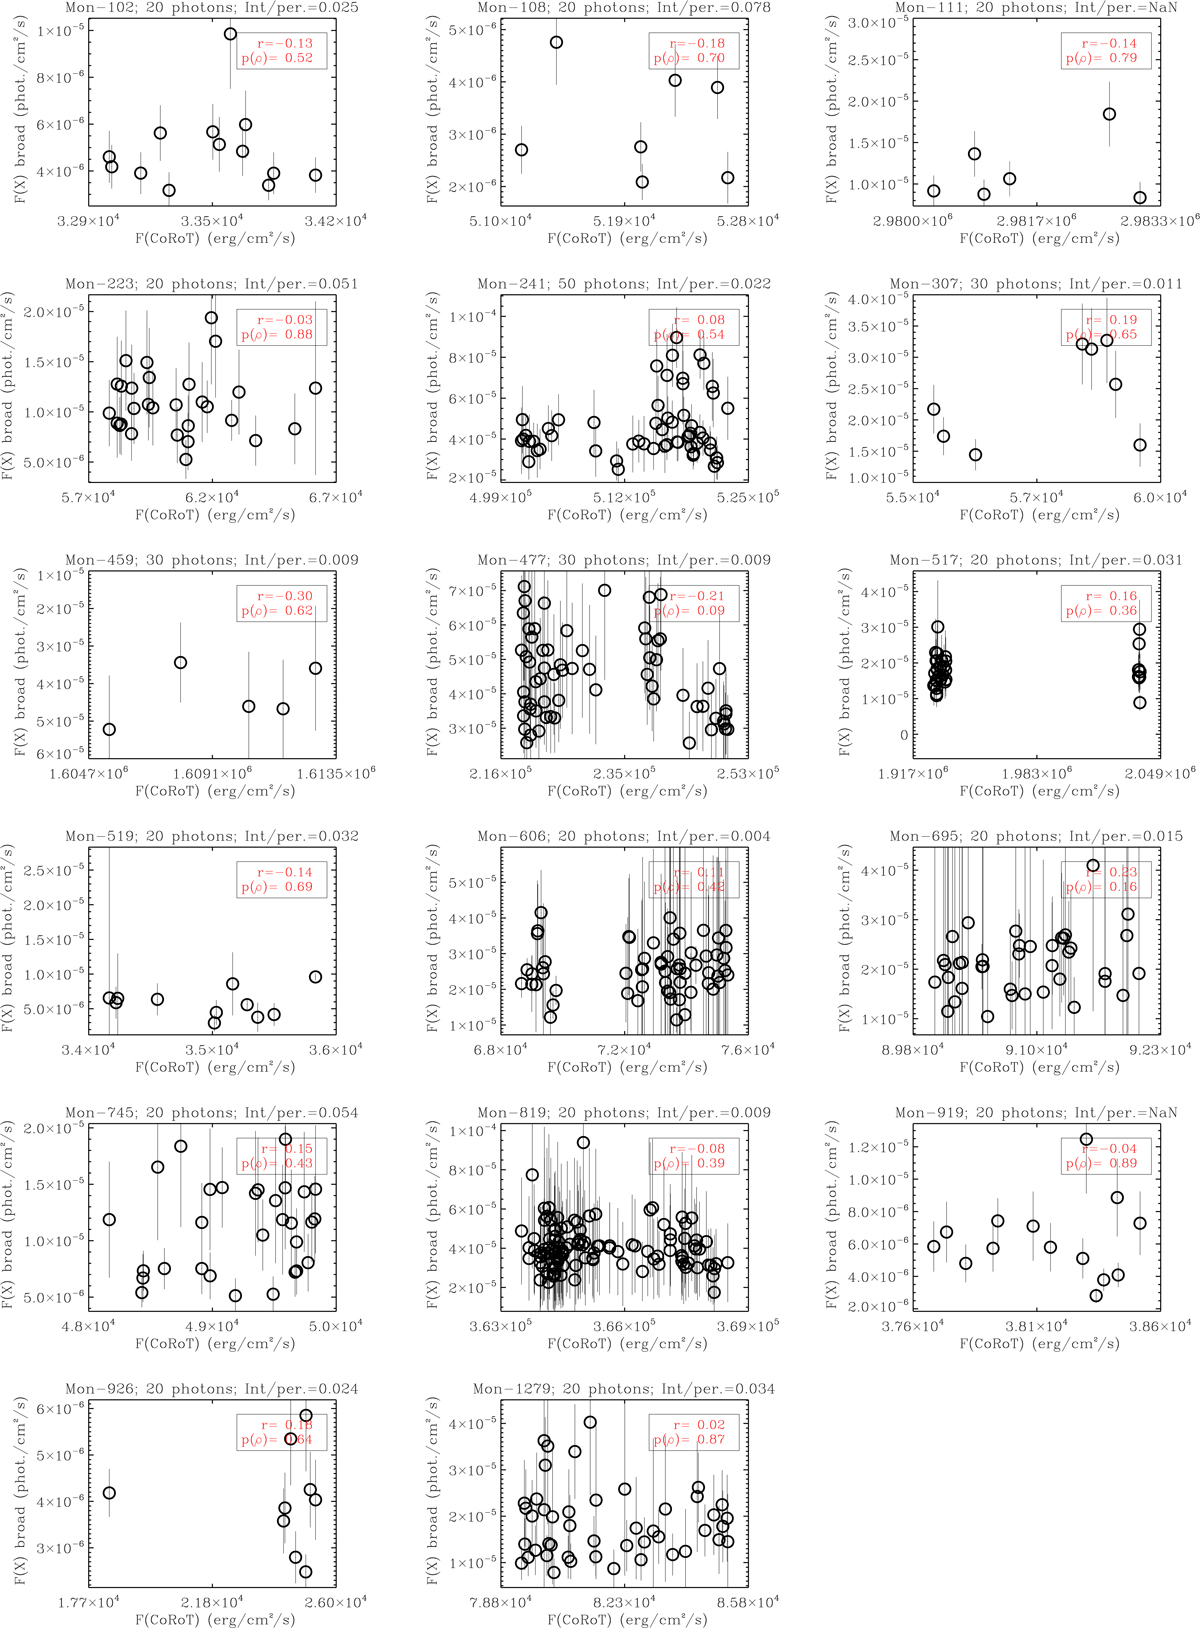
Optical (x axis) and X-ray (y axis) average fluxes observed in the defined time intervals for the stars in the not correlated group. The Mon-name of the star, the number of photons contained in each time interval (Nphot), and the results of the Spearman correlation test are also shown.
Current usage metrics show cumulative count of Article Views (full-text article views including HTML views, PDF and ePub downloads, according to the available data) and Abstracts Views on Vision4Press platform.
Data correspond to usage on the plateform after 2015. The current usage metrics is available 48-96 hours after online publication and is updated daily on week days.
Initial download of the metrics may take a while.