Fig. 2.
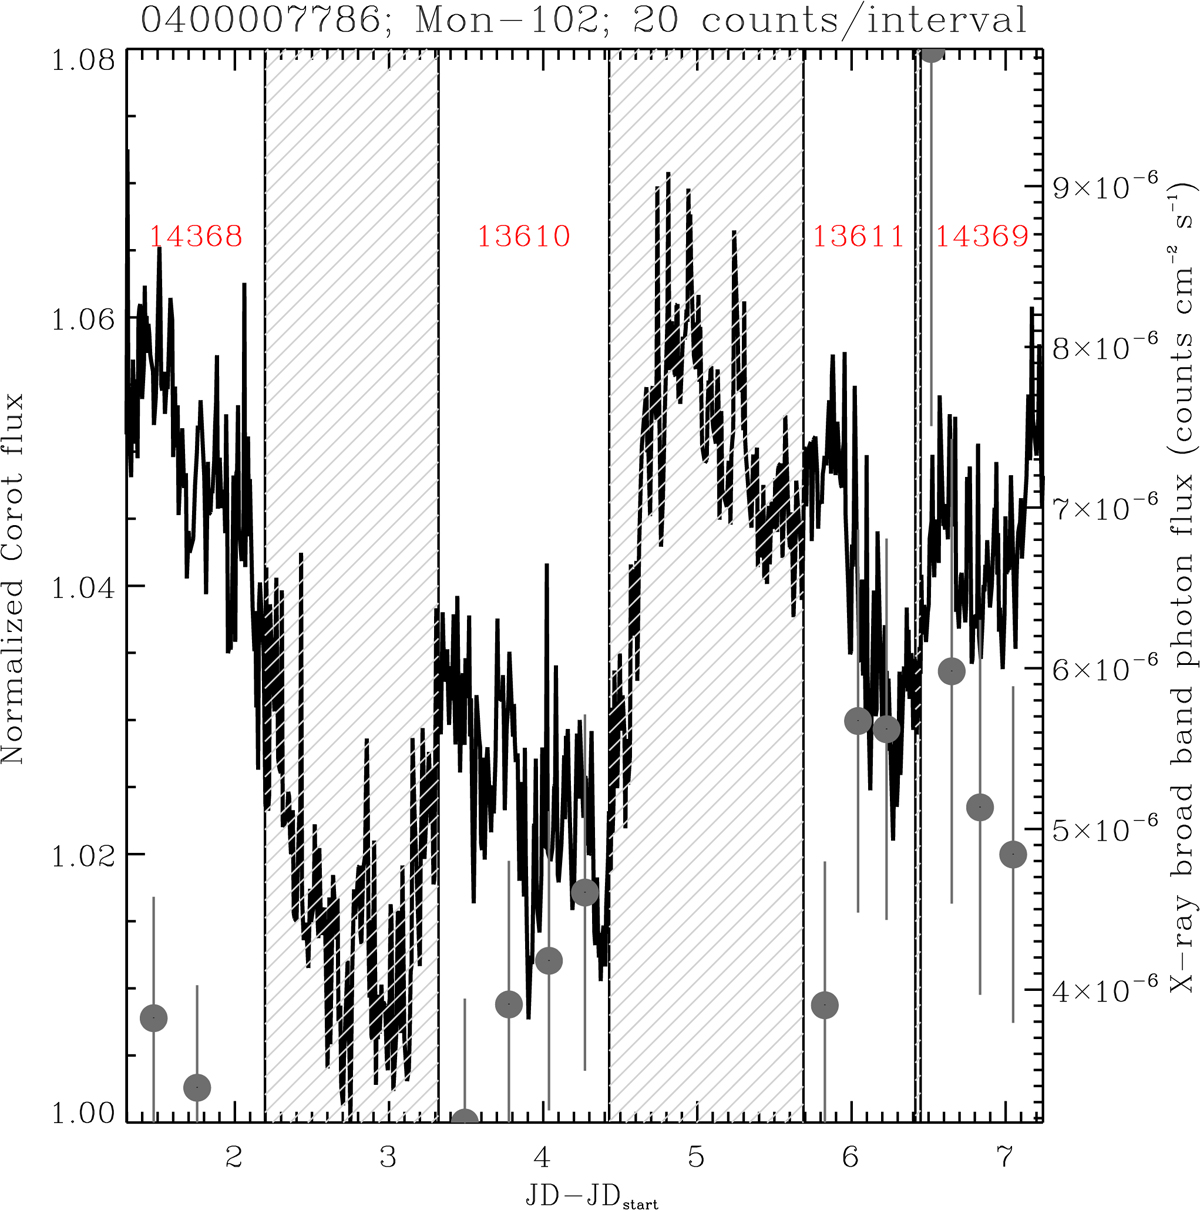
Optical and X-ray light curve of the star Mon-102. The black line shows the CoRoT light curve. The time windows corresponding to the Chandra observations are the unshaded intervals. The gray dots mark the observed average X-ray photon fluxes in the broadband in the time intervals defined by setting the number of photons per interval to Nphot=20 (circled if an X-ray flare occurred during the corresponding time interval; see the figures in Appendix A). The red numbers in the top indicate the Chandra Obs.ID of the given Chandra observation.
Current usage metrics show cumulative count of Article Views (full-text article views including HTML views, PDF and ePub downloads, according to the available data) and Abstracts Views on Vision4Press platform.
Data correspond to usage on the plateform after 2015. The current usage metrics is available 48-96 hours after online publication and is updated daily on week days.
Initial download of the metrics may take a while.