Fig. 13.
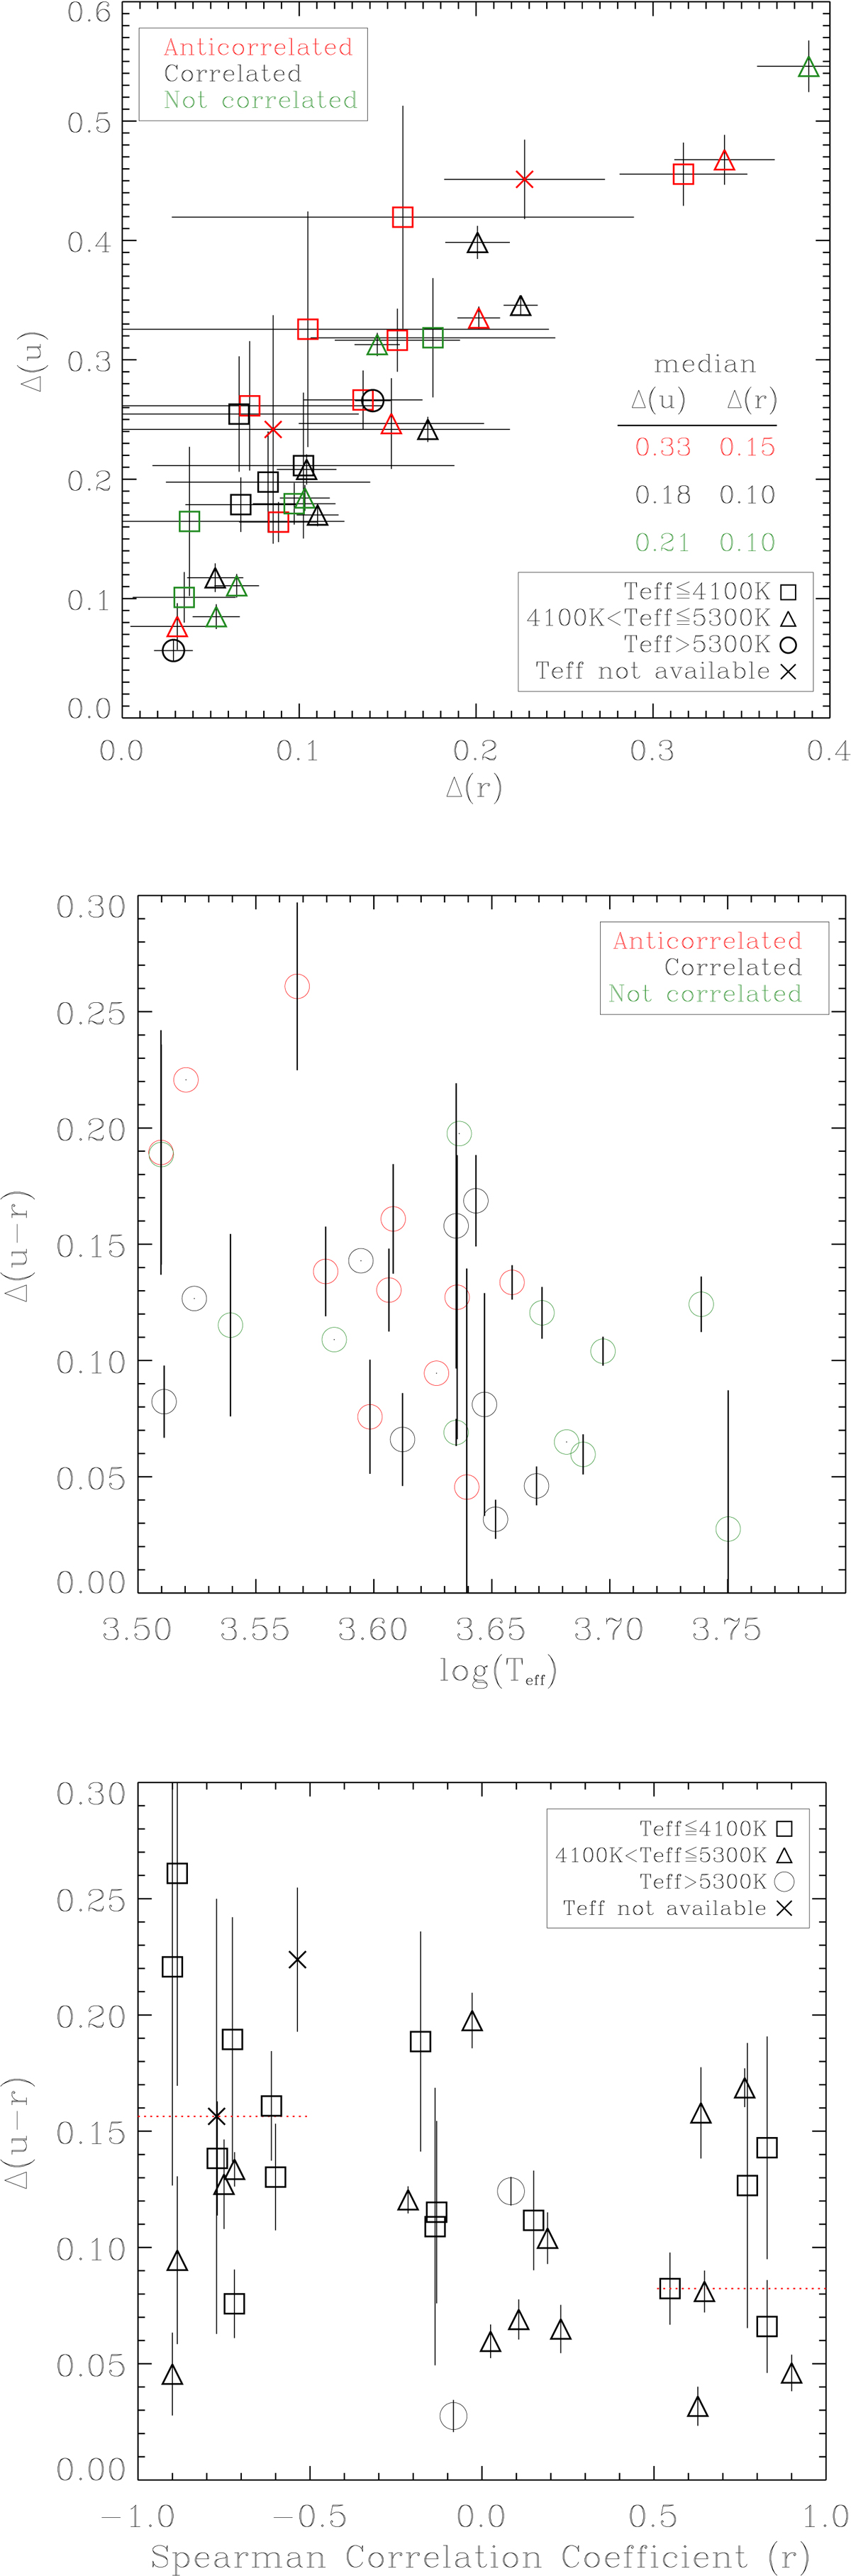
Top panel: variability in u and r bands for the stars in the three correlation groups. Central panel: variability in u − r vs. stellar effective temperature. Bottom panel: variability in u − r vs. the Spearman correlation coefficient. Top and bottom panels: different symbols are used to mark stars in three different ranges of effective temperature, roughly corresponding to M, K, and G stars. Top and central panels: different colors are used to plot stars in the three correlation groups. Despite the large spread observed, the plots suggest a slightly larger median variability in color for the anti-correlated sources.
Current usage metrics show cumulative count of Article Views (full-text article views including HTML views, PDF and ePub downloads, according to the available data) and Abstracts Views on Vision4Press platform.
Data correspond to usage on the plateform after 2015. The current usage metrics is available 48-96 hours after online publication and is updated daily on week days.
Initial download of the metrics may take a while.