Fig. D.11.
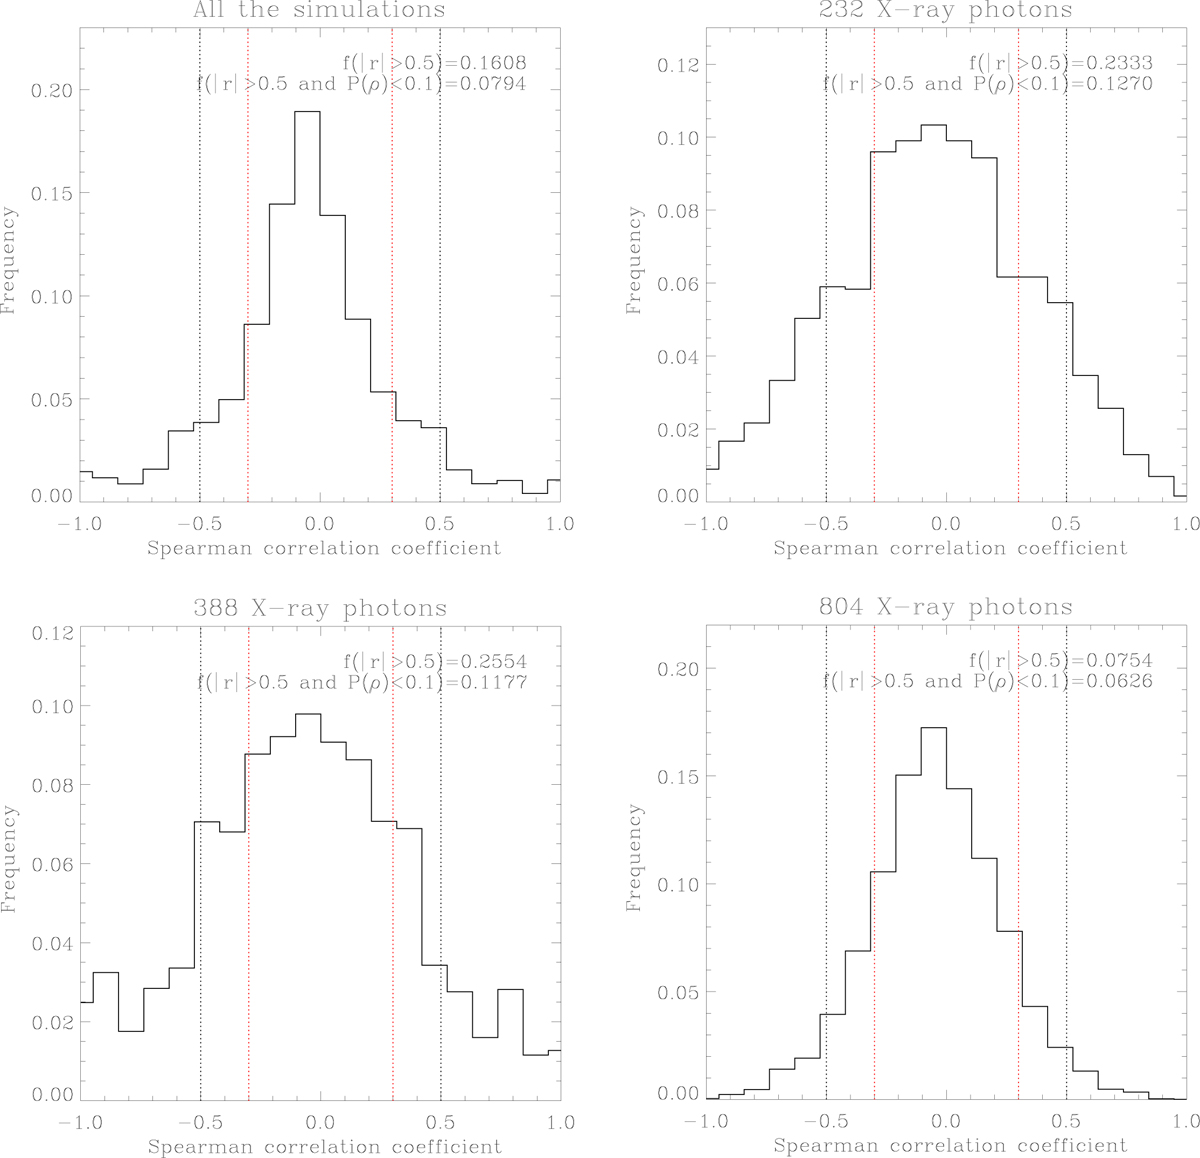
Distribution of the Spearman two-ranks correlation coefficient obtained from the all simulated random curves (left upper panel) and then simulating the X-ray curve adopting three different values of total counts: 232, 388, and 804. In the upper right corner of each panel we show the fraction of simulations resulting in a correlated or anti-correlated variability with and without considering the requirement P(ρ) < 0.1.
Current usage metrics show cumulative count of Article Views (full-text article views including HTML views, PDF and ePub downloads, according to the available data) and Abstracts Views on Vision4Press platform.
Data correspond to usage on the plateform after 2015. The current usage metrics is available 48-96 hours after online publication and is updated daily on week days.
Initial download of the metrics may take a while.