Fig. 10.
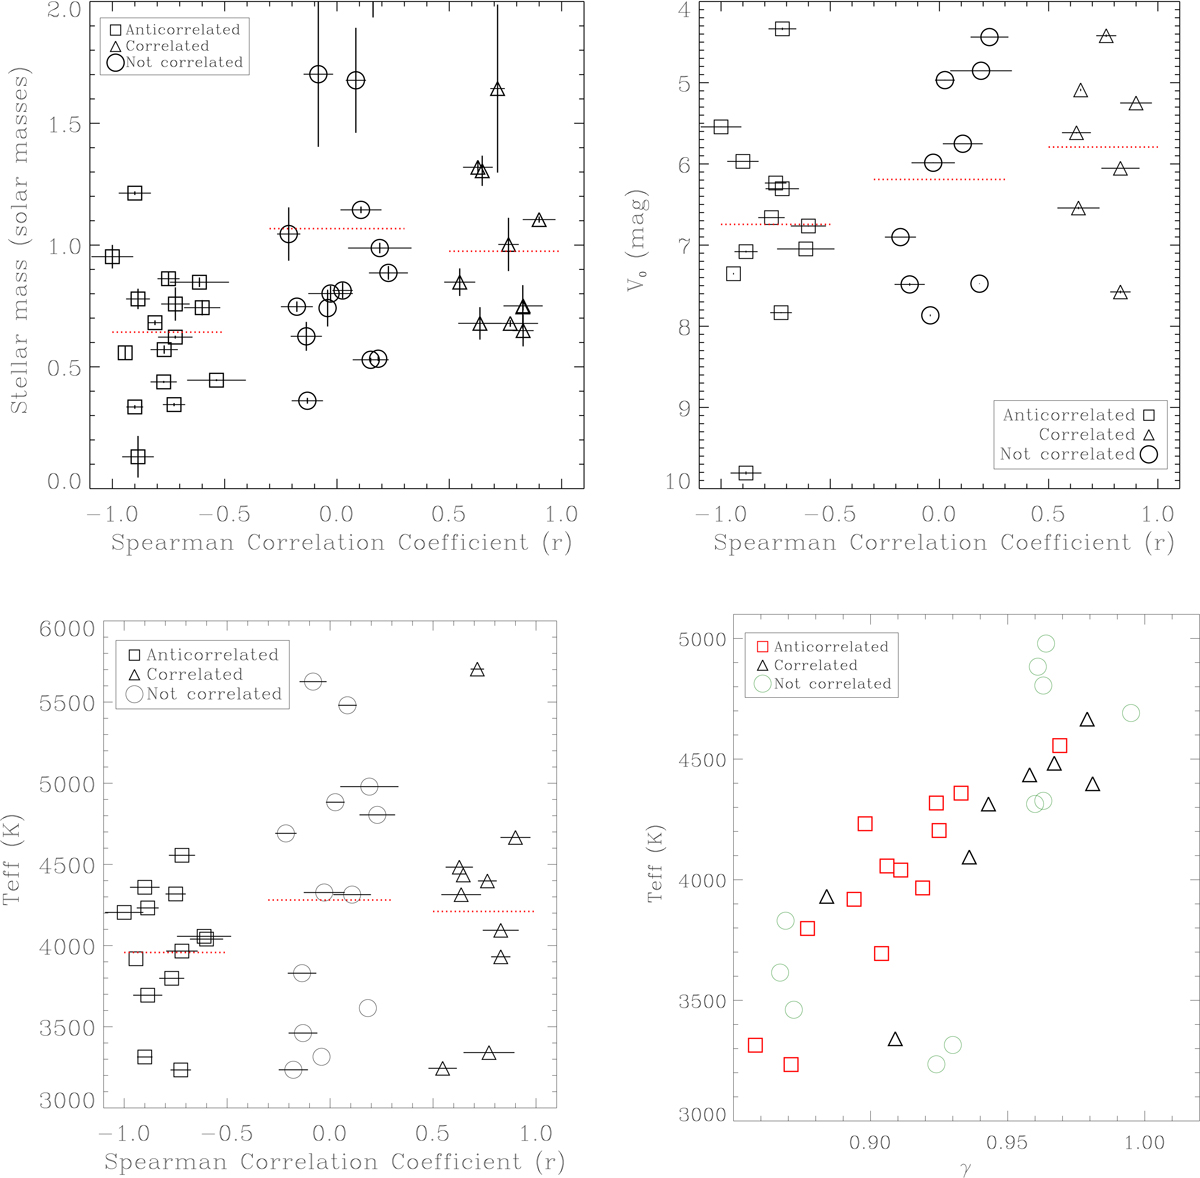
Stellar masses (top left), V0 (top right), and Teff (bottom left) vs. the Spearman’s correlation coefficient. Bottom right panel: Teff vs. γ scatter plot. Stars with different correlation between the optical and X-ray variability are marked with different symbols as shown in the labels. The horizontal dotted lines mark the median values. All the plots suggest that the stars in the “anti correlated” group are on average less massive than those in the other two groups.
Current usage metrics show cumulative count of Article Views (full-text article views including HTML views, PDF and ePub downloads, according to the available data) and Abstracts Views on Vision4Press platform.
Data correspond to usage on the plateform after 2015. The current usage metrics is available 48-96 hours after online publication and is updated daily on week days.
Initial download of the metrics may take a while.