Fig. 1.
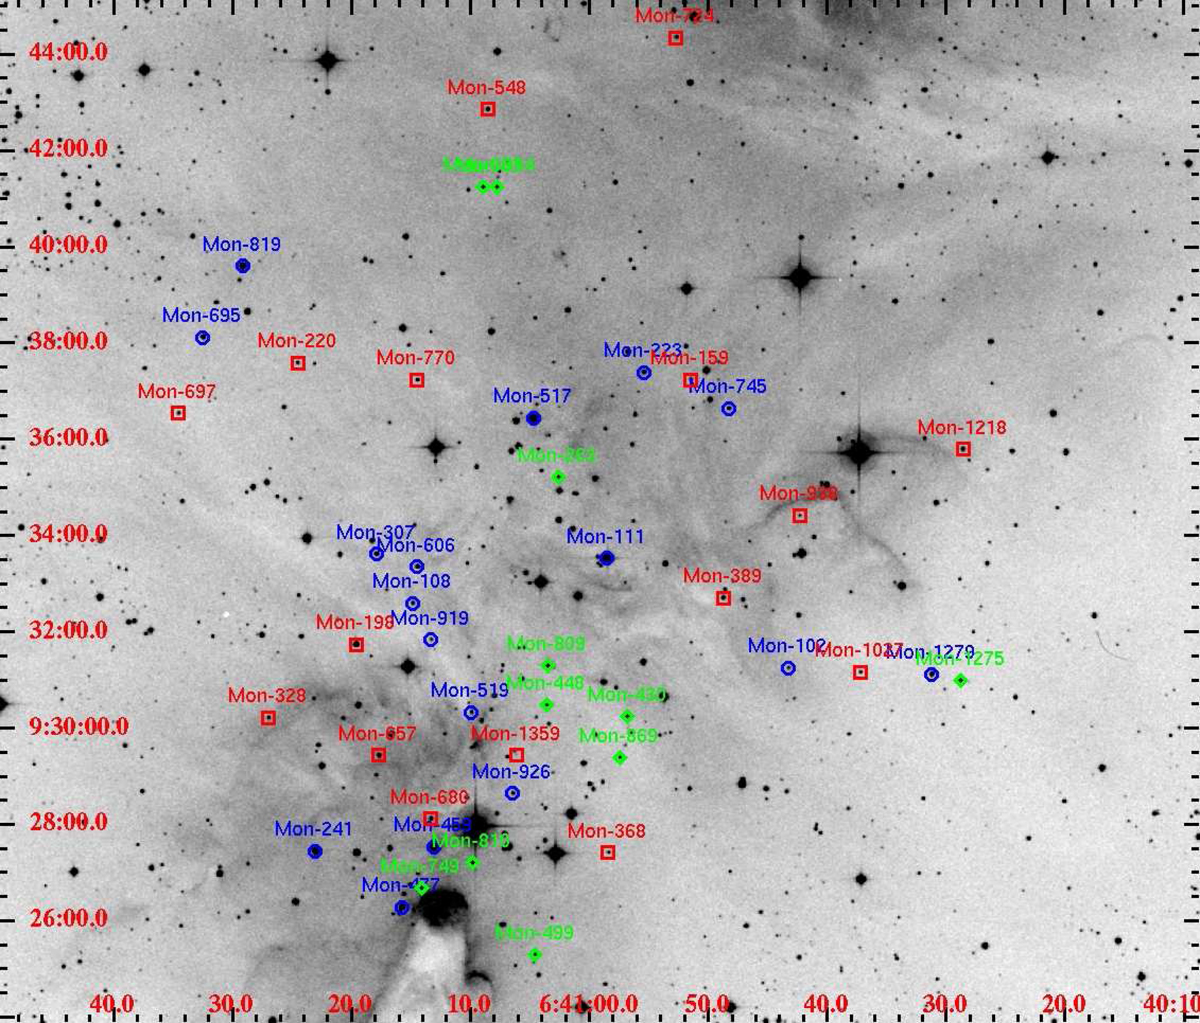
DSS-2 image of the central region of NGC 2264, with the sources analyzed in this paper marked with different colors and symbols corresponding to their final classification (red squares: anti-correlated sources; green diamonds: correlated sources; blue circles not correlated sources; see Sect. 3.1). The labels indicate the Mon- name of each star. Right ascension in the x-axis, declination in the y-axis.
Current usage metrics show cumulative count of Article Views (full-text article views including HTML views, PDF and ePub downloads, according to the available data) and Abstracts Views on Vision4Press platform.
Data correspond to usage on the plateform after 2015. The current usage metrics is available 48-96 hours after online publication and is updated daily on week days.
Initial download of the metrics may take a while.