Fig. 3.
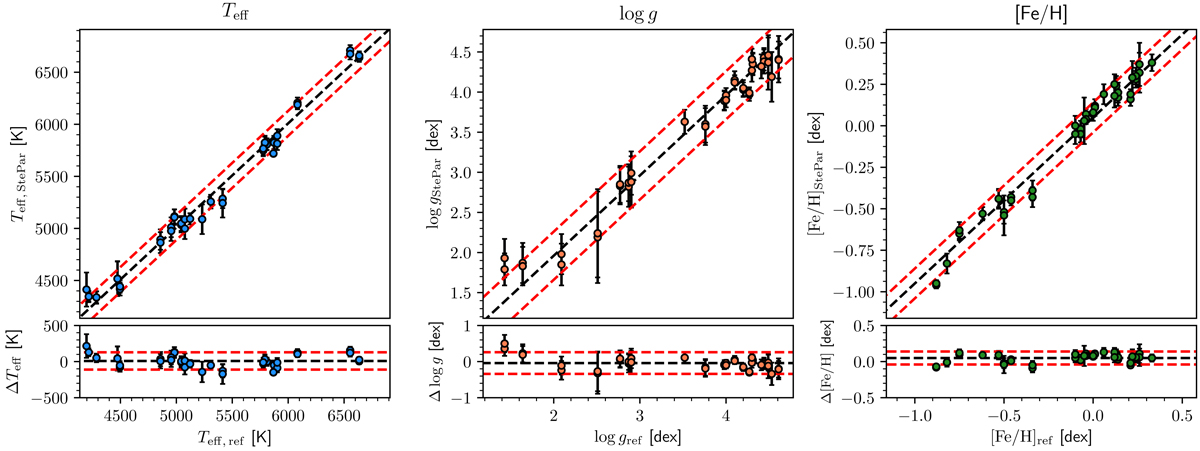
STEPAR results for the Gaia benchmark stars plotted against the literature values taken from Heiter et al. (2015b), with updated values from Jofré et al. (2019). Upper panels: one-to-one correspondence, whereas bottom panels: absolute differences. Using the values in Table 3, the dashed black lines in the upper panels correspond to a one-to-one relationship, shifted following the average differences in each parameter, whereas in the bottom panels they are centred on the average differences. The dashed red lines in all panels correspond to a margin of 120 K, 0.30 dex, and 0.09 dex in Teff, log g, and [Fe/H], respectively, according to the σ values found in the differences in each parameter.
Current usage metrics show cumulative count of Article Views (full-text article views including HTML views, PDF and ePub downloads, according to the available data) and Abstracts Views on Vision4Press platform.
Data correspond to usage on the plateform after 2015. The current usage metrics is available 48-96 hours after online publication and is updated daily on week days.
Initial download of the metrics may take a while.