Fig. 2.
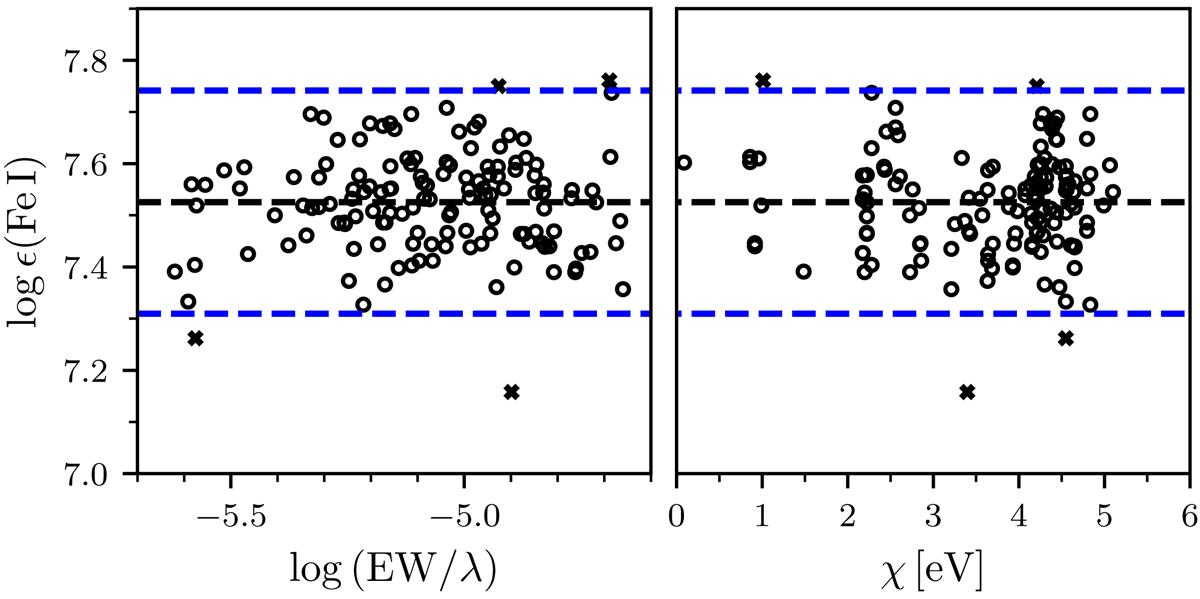
STEPAR inner 3σ clipping of the Fe I lines on the NARVAL spectrum of the Sun. log ϵ(Fe I) stands for the Fe abundance returned by the Fe lines, while log (EW/λ) represents their reduced EWs. Black crosses depict the rejected Fe I lines. The dashed black lines represent a linear fit to the points, whereas the dashed blue lines are located at the 3σ level.
Current usage metrics show cumulative count of Article Views (full-text article views including HTML views, PDF and ePub downloads, according to the available data) and Abstracts Views on Vision4Press platform.
Data correspond to usage on the plateform after 2015. The current usage metrics is available 48-96 hours after online publication and is updated daily on week days.
Initial download of the metrics may take a while.