Fig. 4.
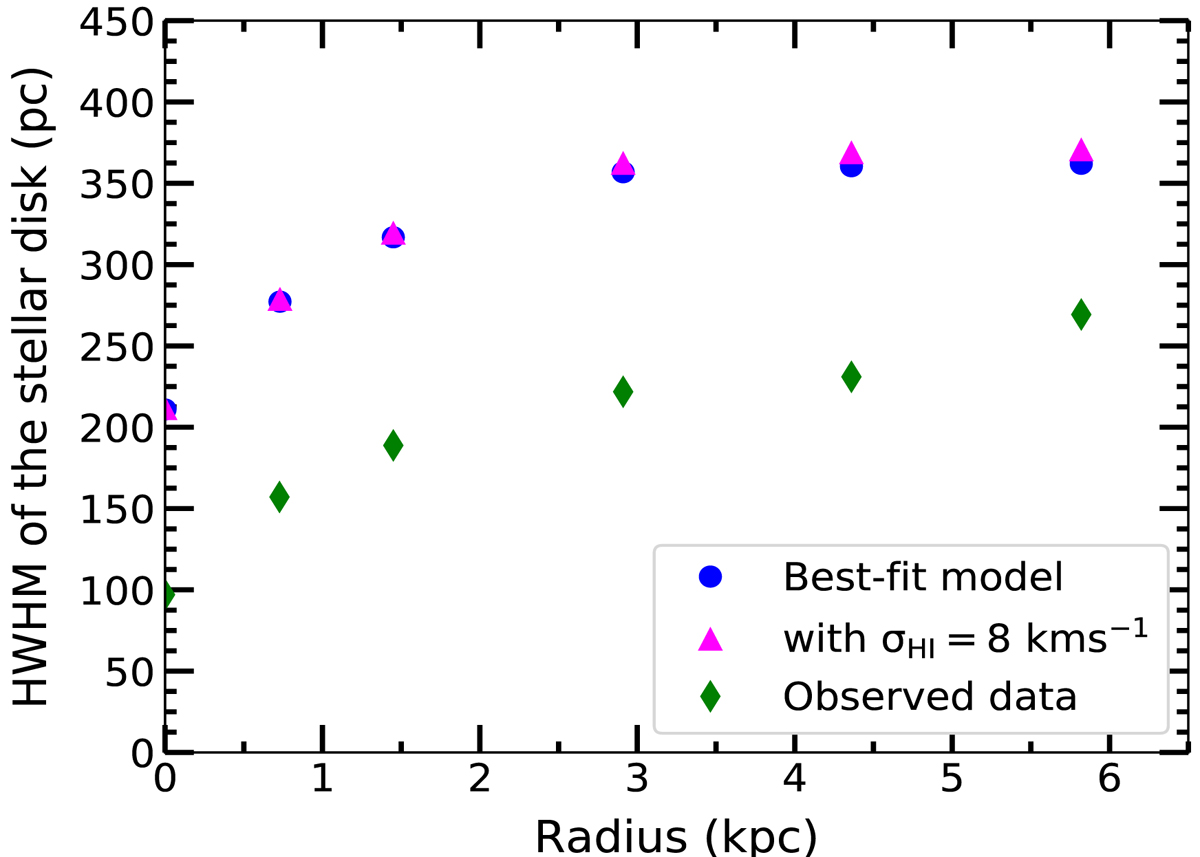
Results for variation in stellar disk thickness on changing HI velocity dispersion from 7 to 8 km s−1. This causes the stellar disk to puff up a little, and therefore the disk thickness is higher than that obtained with 7 km s−1. Because the values of thickness are closer to the data from 7 km s−1, this is considered to obtain the best-fit model.
Current usage metrics show cumulative count of Article Views (full-text article views including HTML views, PDF and ePub downloads, according to the available data) and Abstracts Views on Vision4Press platform.
Data correspond to usage on the plateform after 2015. The current usage metrics is available 48-96 hours after online publication and is updated daily on week days.
Initial download of the metrics may take a while.