Fig. 6
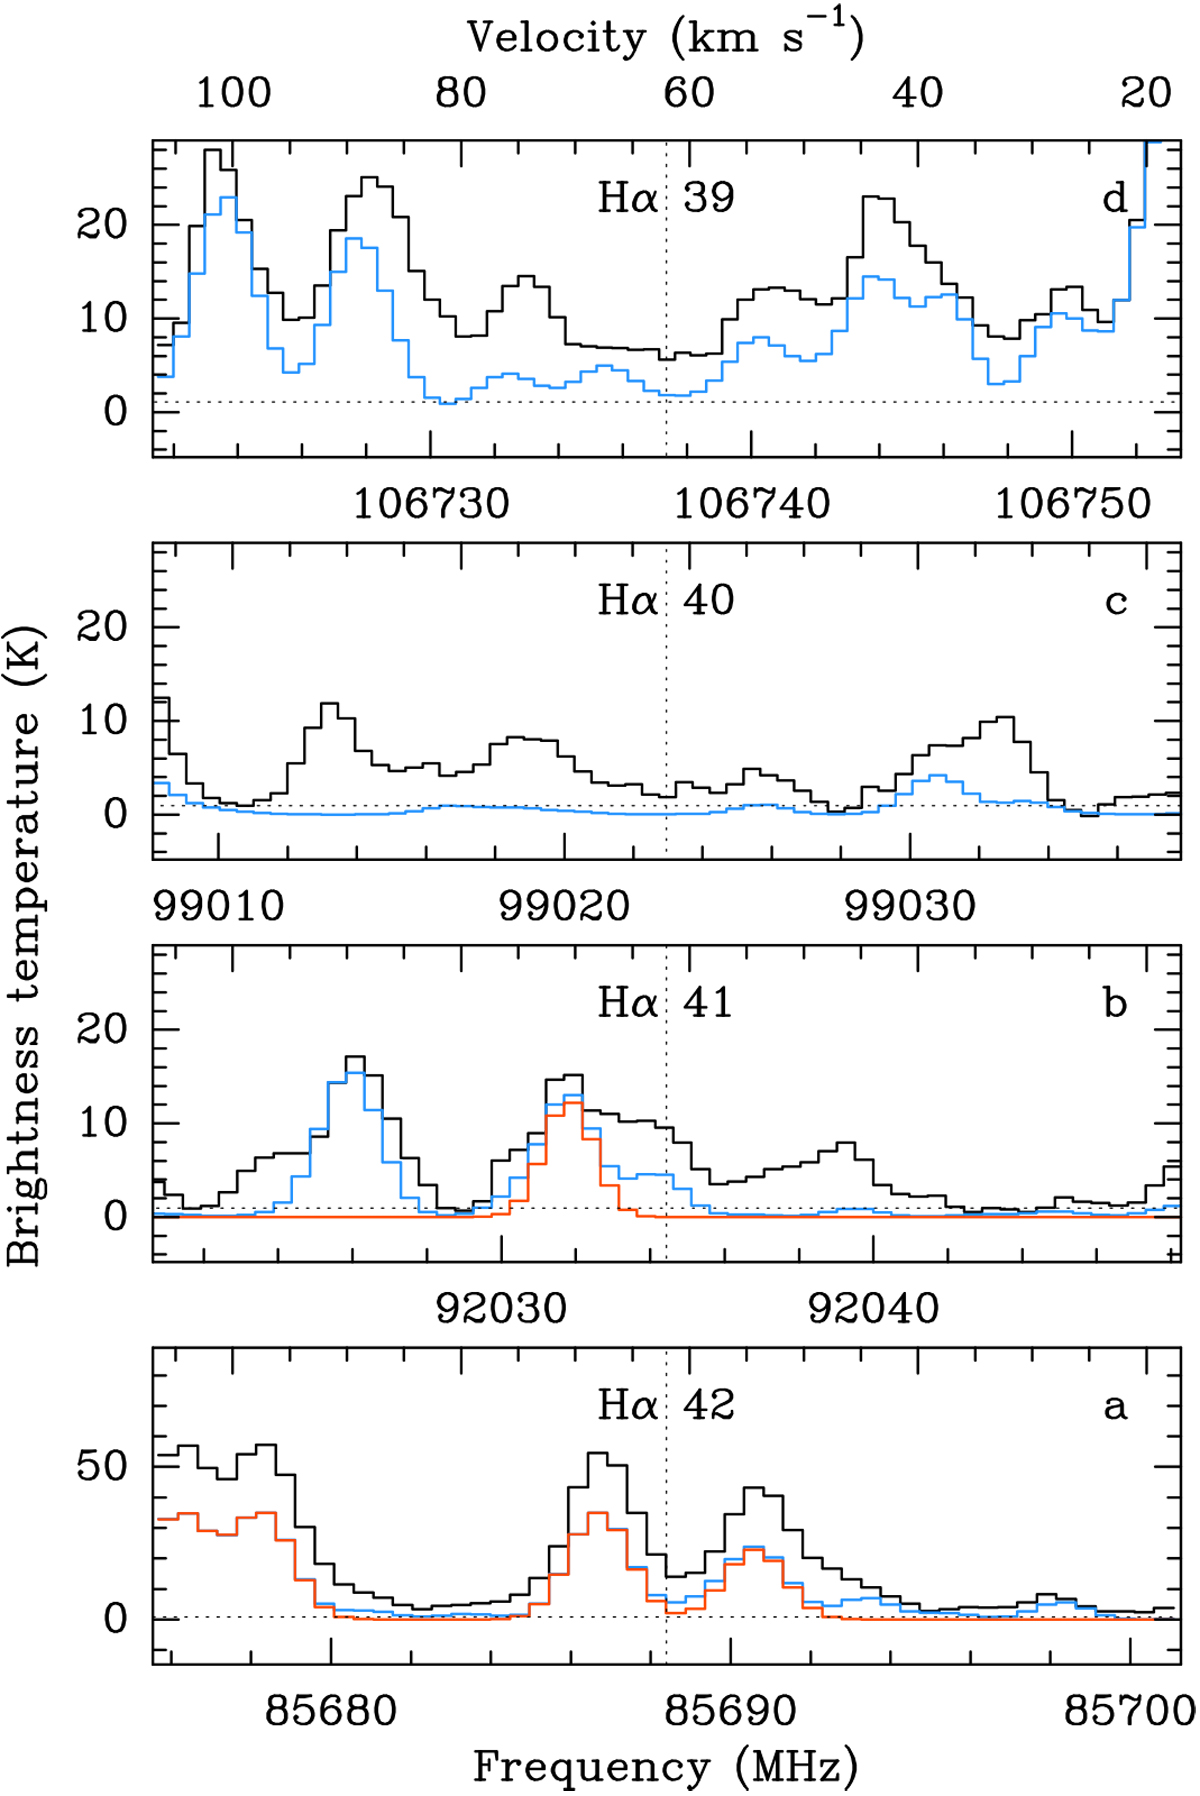
Portions of the continuum-removed ReMoCA spectrum of Sgr B2(N1S) that cover the frequencies of Hα recombination lines. The frequency of each Hα line is marked with a dotted line in each panel and the name of the transition is indicated. The lower and upper axesof each panel are labeled in frequency and velocity, respectively, assuming a systemic velocity of 62 km s−1. The velocity range is the same for all panels. The blue spectrum represents our current (preliminary) LTE model that includes contributions from all identified molecules. It is overlaid on the ALMA spectrum displayed in black. The red spectrum in panel a is our current LTE synthetic spectrum of C2 H3CN, v11 = 1 while the red spectrum in panel b is our best-fit LTE synthetic spectrum of urea.
Current usage metrics show cumulative count of Article Views (full-text article views including HTML views, PDF and ePub downloads, according to the available data) and Abstracts Views on Vision4Press platform.
Data correspond to usage on the plateform after 2015. The current usage metrics is available 48-96 hours after online publication and is updated daily on week days.
Initial download of the metrics may take a while.