Fig. 3
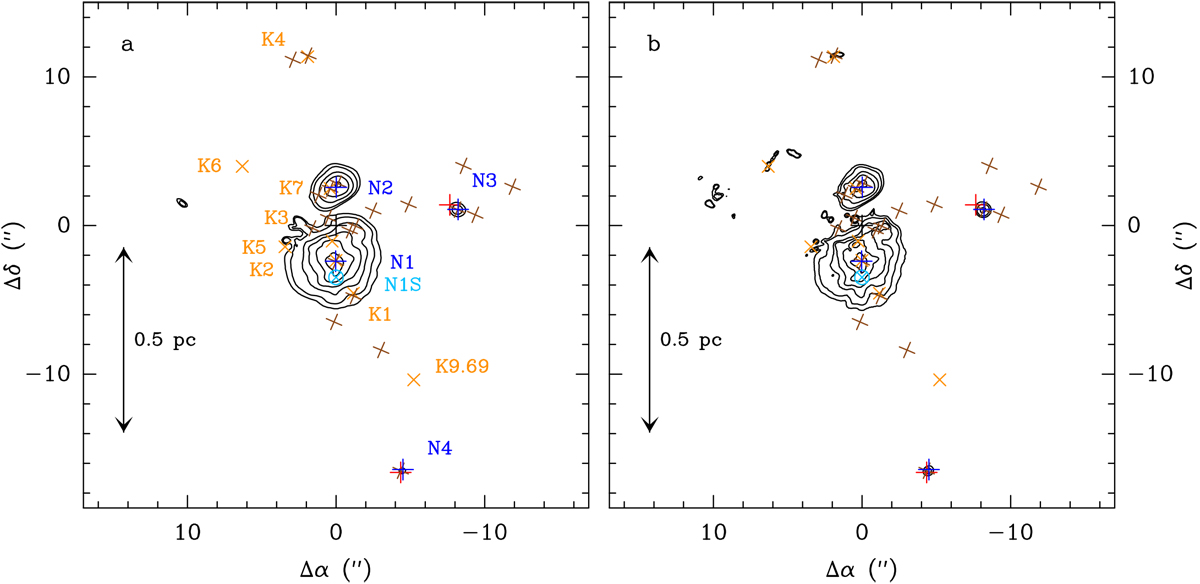
Contour maps of the number of channels with continuum-subtracted flux density above the 10σ level. (a) Only setups S1, S2, and S3, which have beam sizes on the order of 0.6′′ –0.7′′, were taken into account. The contours are 1000, 2000, 5000, 10 000 counts, and then increase by steps of 10 000 counts. (b) Only setups S4 and S5, which have beam sizes of approximately 0.4′′ –0.5′′, were taken into account. The contours are 700, 1400, 3500, 7000 counts, and then increase by steps of 7000 counts. The symbols in both panels are the same as in Fig. 2. The lowest contours in some parts of the maps, for instance toward K4 or K6, are affected by inaccuracies in the baseline subtraction and may not trace true line emission.
Current usage metrics show cumulative count of Article Views (full-text article views including HTML views, PDF and ePub downloads, according to the available data) and Abstracts Views on Vision4Press platform.
Data correspond to usage on the plateform after 2015. The current usage metrics is available 48-96 hours after online publication and is updated daily on week days.
Initial download of the metrics may take a while.