Fig. 2
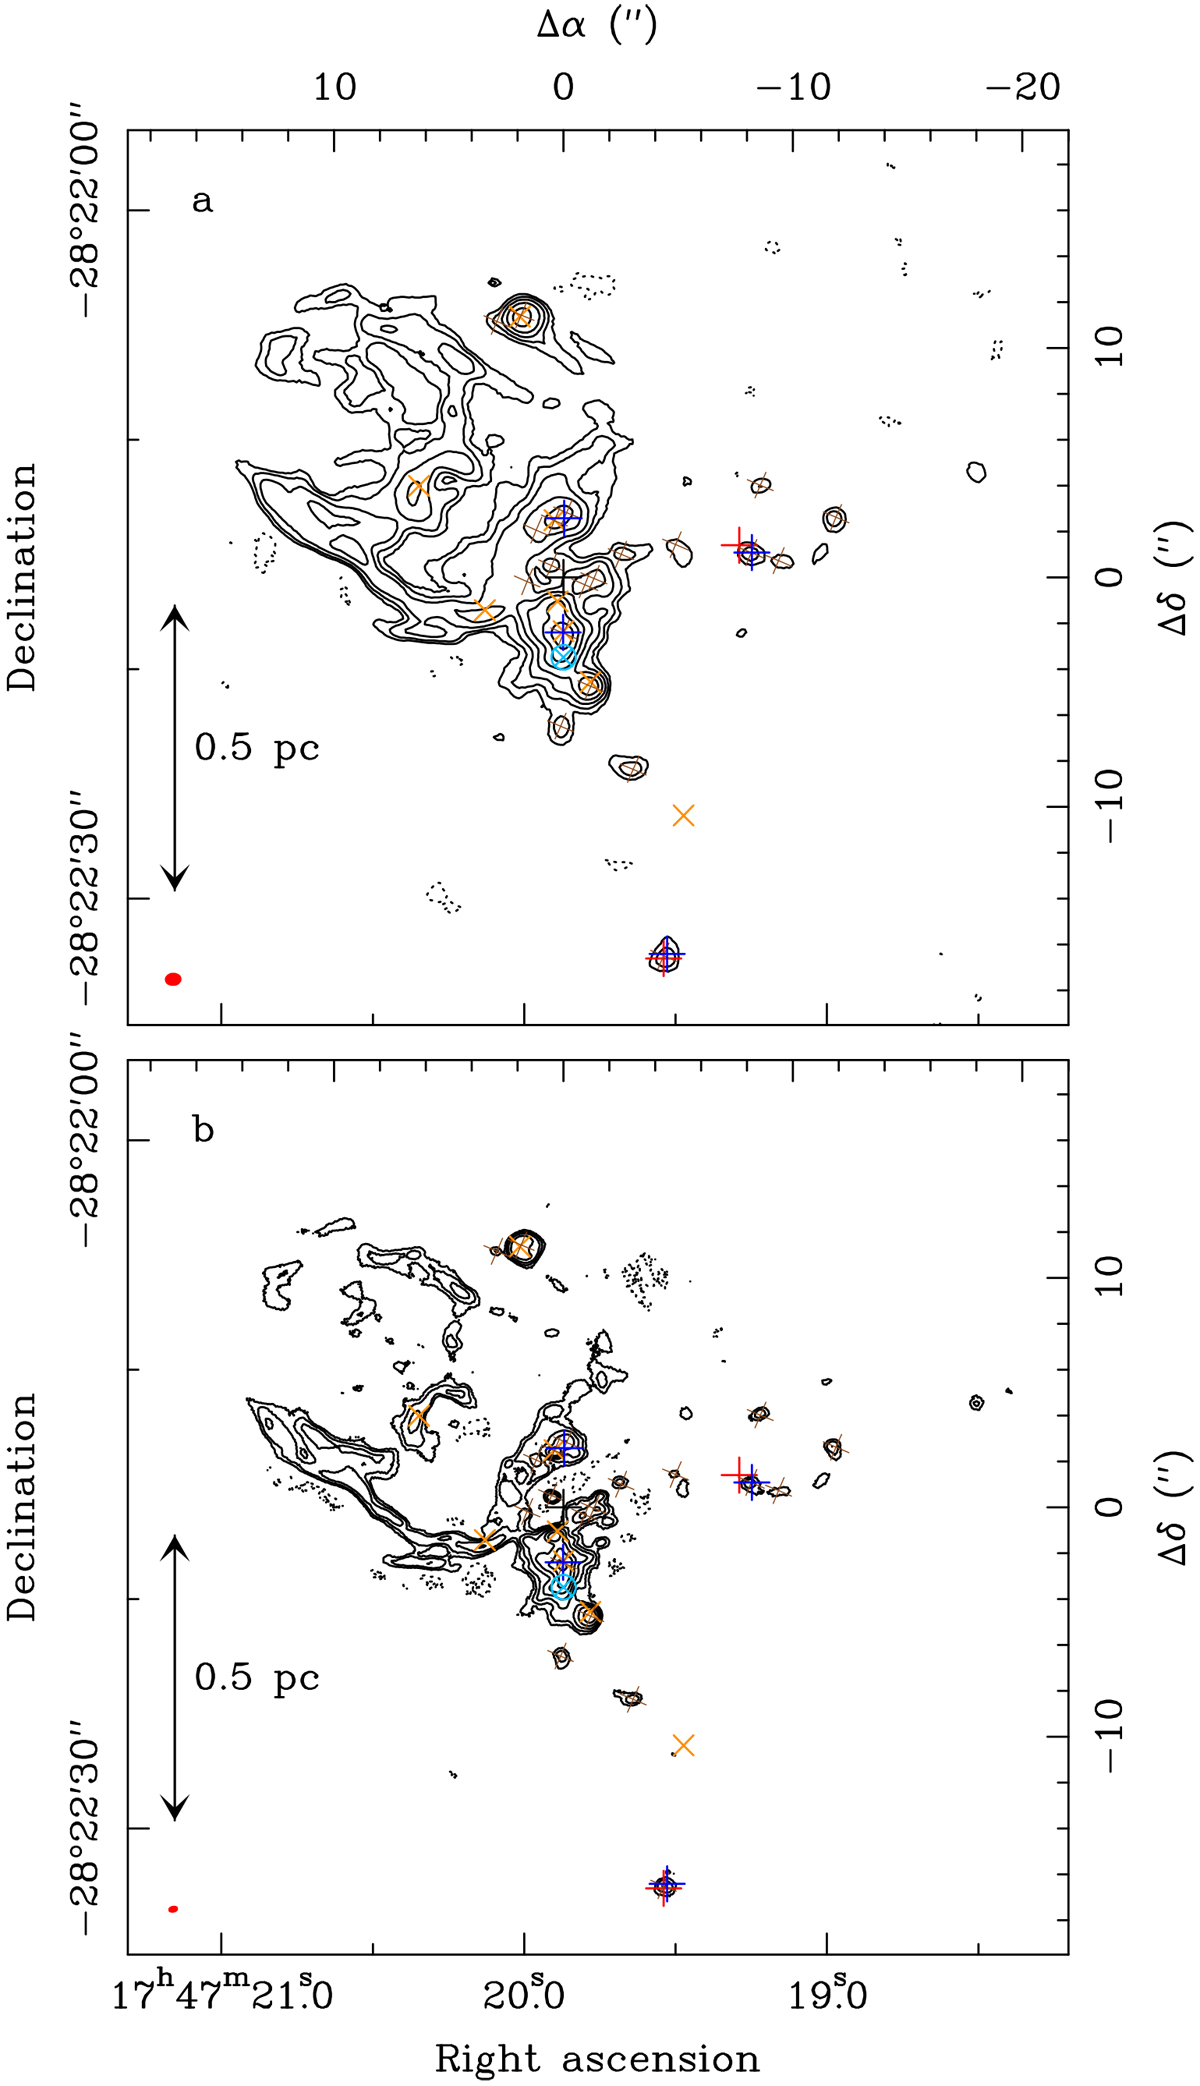
Continuum map at 99.2 GHz extracted from setups S1 (a) and S5 (b), respectively. The contours start at 4σ (a) and 5σ (b) with σ the rms noise level equal to 0.95 and 0.42 mJy beam−1, respectively, and then increase by a factor of two. Negative contours are shown as dotted lines. In each panel, the red ellipse represents the beam (HPBW). The black cross marks the phase center, the dark blue crosses the hot cores N1–N5 reported byBonfand et al. (2017), the light blue cross enclosed in a circle the position N1S, the brown crosses the 1 mm continuum sources detected by Sánchez-Monge et al. (2017) with ALMA, the red crosses Class II methanol masers (Caswell 1996), and the orange crosses the H ii regions reported by Gaume et al. (1995). The names of some of these sources are indicated in Fig. 3. The maps are not corrected for primary-beam attenuation.
Current usage metrics show cumulative count of Article Views (full-text article views including HTML views, PDF and ePub downloads, according to the available data) and Abstracts Views on Vision4Press platform.
Data correspond to usage on the plateform after 2015. The current usage metrics is available 48-96 hours after online publication and is updated daily on week days.
Initial download of the metrics may take a while.