Fig. 1
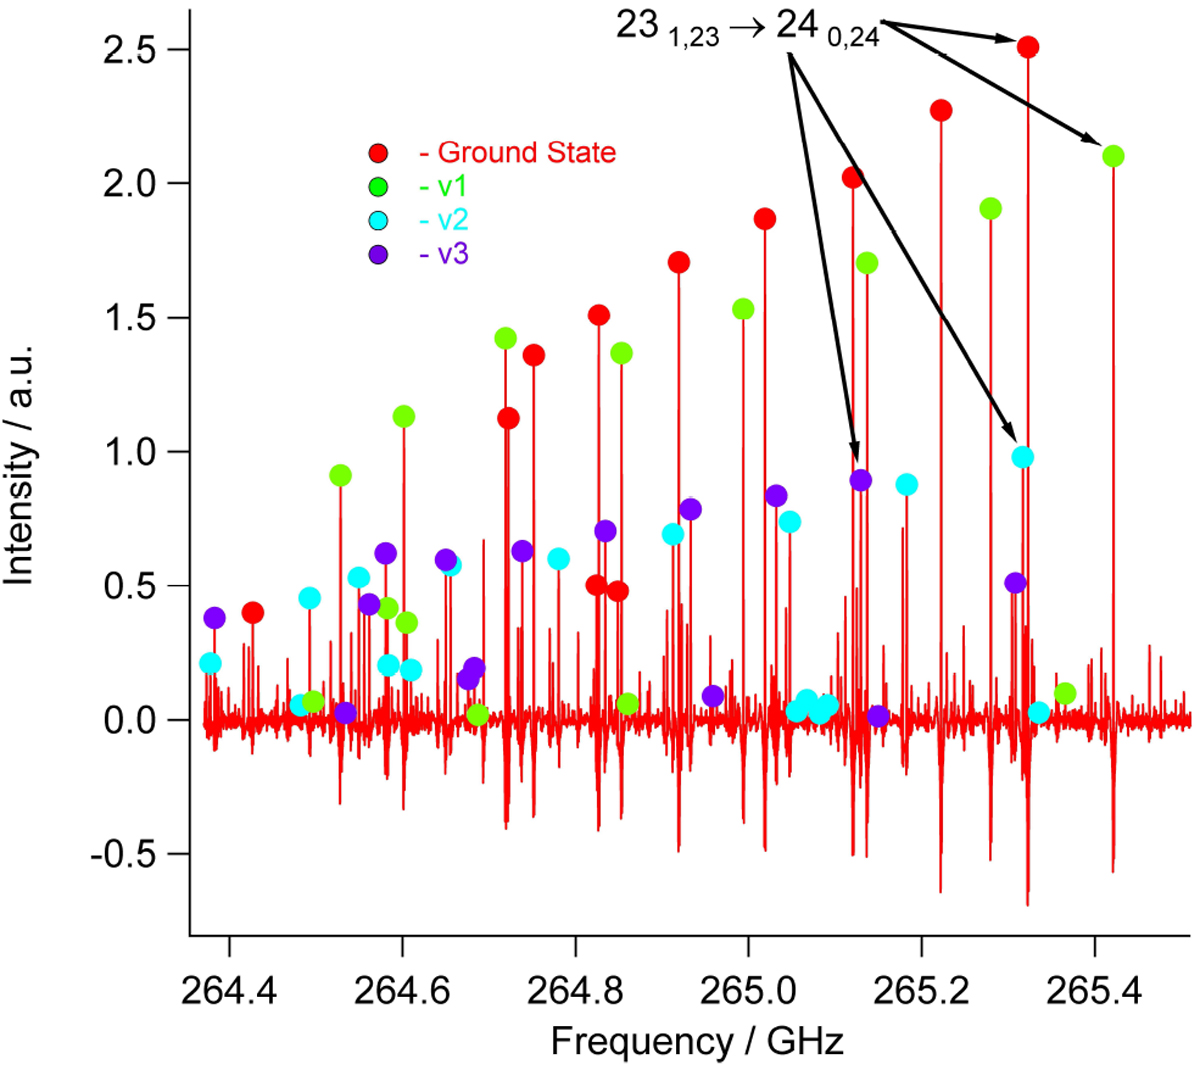
Representative laboratory spectrum of urea used for spectral assignment of the four strongest vibrational states. Red, green, cyan, and purple markers represent the assigned transitions of ground, first, second, and third excited states, respectively. Quantum numbers for one transition with matching rotational quantum numbers across all four states are marked with arrows. These types of transitions were used for the calculation of the vibrational energies through spectral intensity ratios.
Current usage metrics show cumulative count of Article Views (full-text article views including HTML views, PDF and ePub downloads, according to the available data) and Abstracts Views on Vision4Press platform.
Data correspond to usage on the plateform after 2015. The current usage metrics is available 48-96 hours after online publication and is updated daily on week days.
Initial download of the metrics may take a while.