Fig. 1
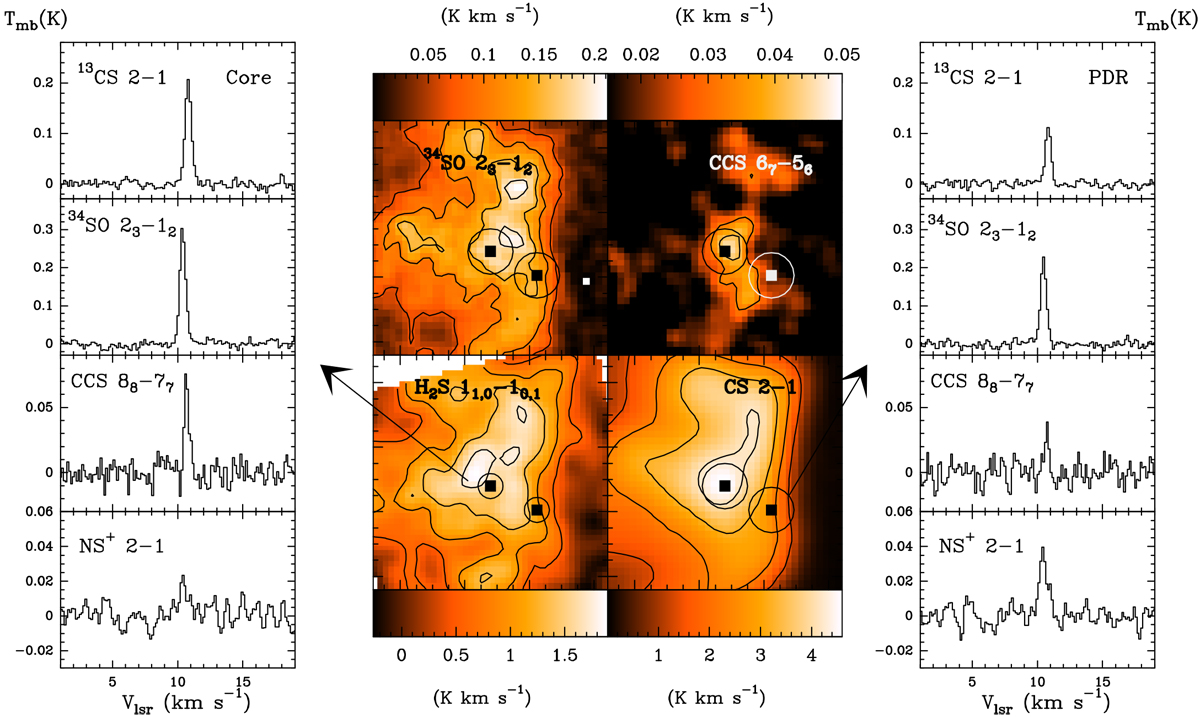
Integrated intensity maps of the 13CS 2 →1, 34 SO 23 → 12, CCS 87 → 76, and H2S 11,0 → 10,1 maps as observed with the 30 m IRAM telescope. The beam of the 30 m telescope at 3 mm (HPBW ~ 29′′) is indicated by two circles centred on the positions targeted within the Whisper spectral survey. Line contours depict 30–90 by 15% levels with respect to the emission peak.
Current usage metrics show cumulative count of Article Views (full-text article views including HTML views, PDF and ePub downloads, according to the available data) and Abstracts Views on Vision4Press platform.
Data correspond to usage on the plateform after 2015. The current usage metrics is available 48-96 hours after online publication and is updated daily on week days.
Initial download of the metrics may take a while.