Fig. 9
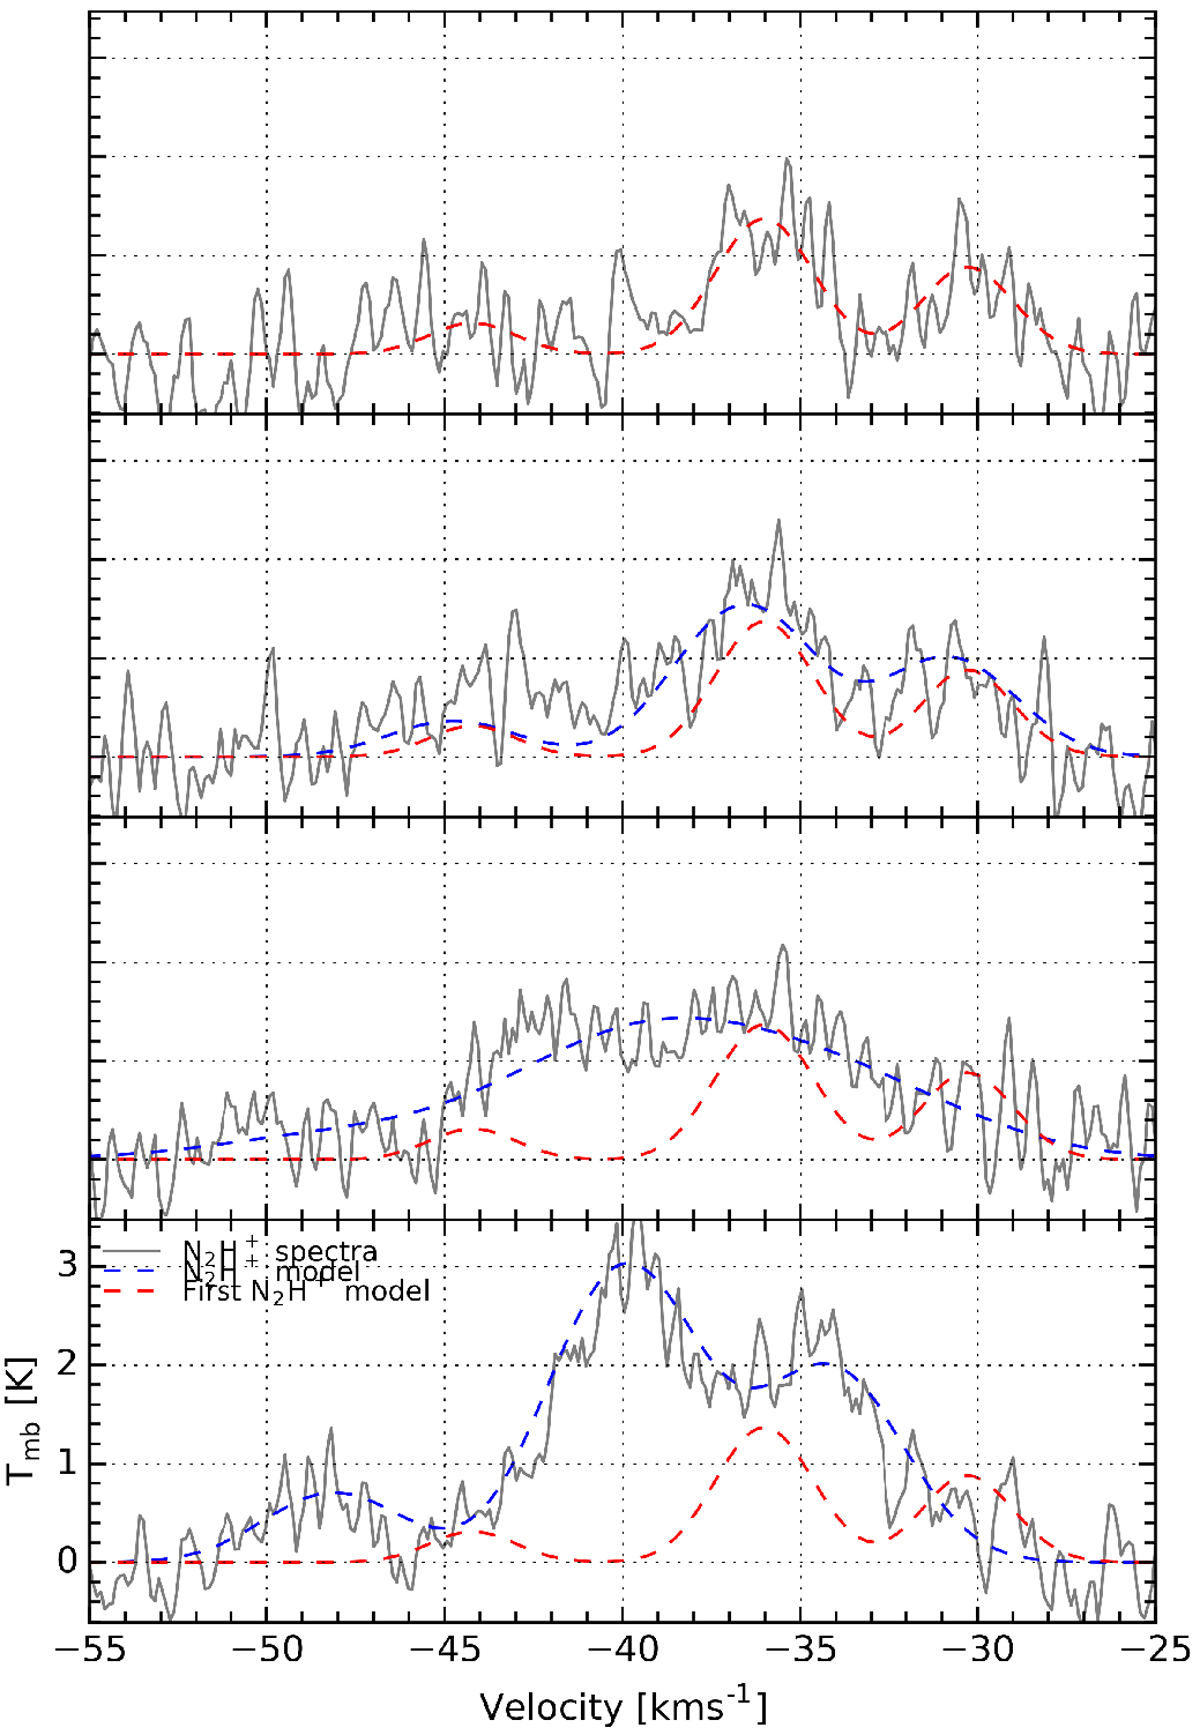
Four vertical panels showing N2H+ (J = 1–0) spectra and corresponding fitted models at four different positions from left to right as indicated by the arrow in Fig. 7b. The solid grey line are the observed spectra at each location. The red dashed line corresponds to the best fit model of the top panel spectrum, which has then been over-plotted on the bottom three panels for reference. The dashed blue lines correspond to the best fit models to the bottom three spectra. All fits have been calculated using GILDAS.
Current usage metrics show cumulative count of Article Views (full-text article views including HTML views, PDF and ePub downloads, according to the available data) and Abstracts Views on Vision4Press platform.
Data correspond to usage on the plateform after 2015. The current usage metrics is available 48-96 hours after online publication and is updated daily on week days.
Initial download of the metrics may take a while.