Fig. 7
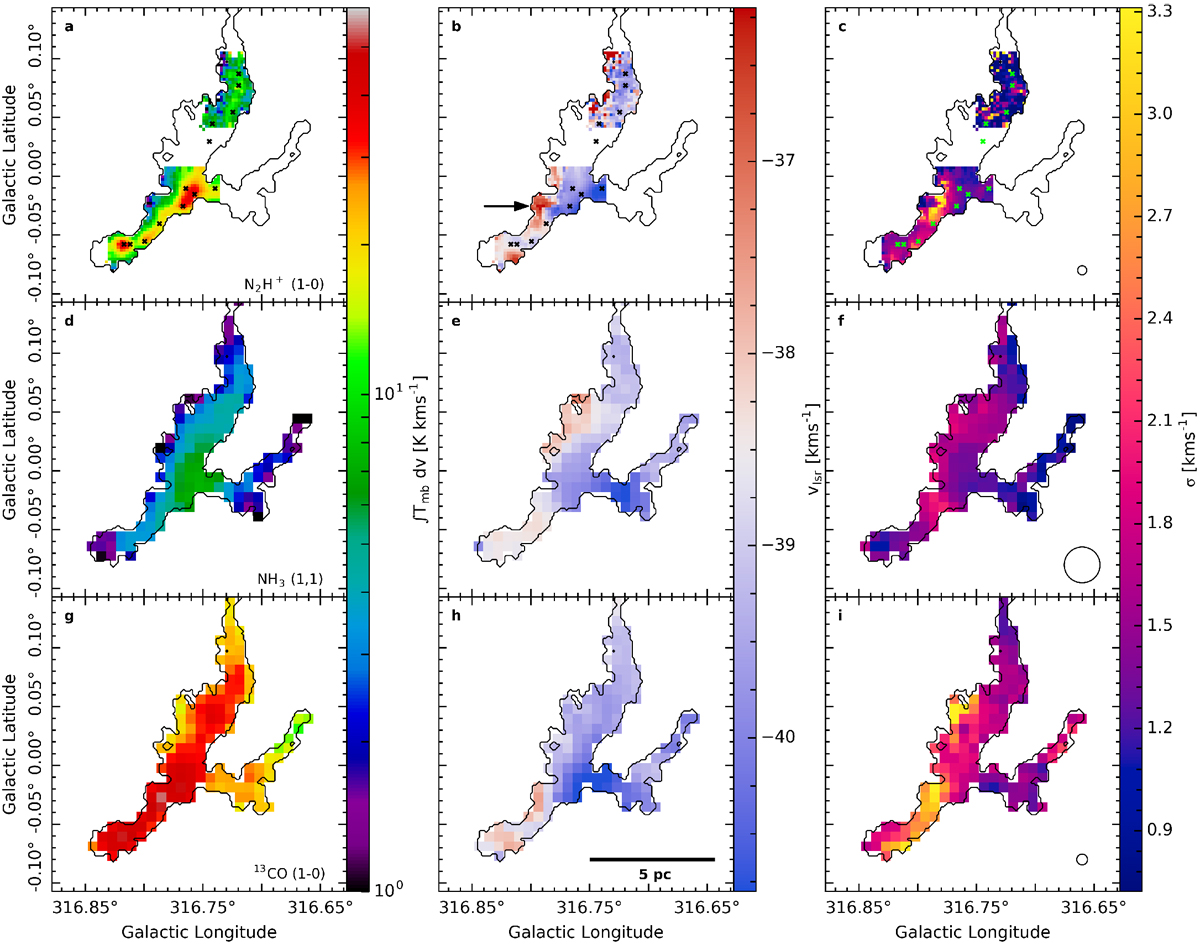
Molecular transition analysis for N2H+ (J = 1–0) (top), NH3 (1,1) (middle) and 13CO (J = 1–0) (bottom). First column shows the integrated intensity between −42.5 and −33 km s−1. The second column shows the radial velocity and the third column shows the velocity dispersion. The over-plotted contour corresponds to an H2 column density of 0.312 × 1023 cm−2 (see Sect. 4.1). Each dataset has been masked according to this contour and is used to estimate the properties of G316.75 in Table 3. The molecular transition used has been labeled in the bottom right of of the first column. The open black circle in the last column shows the FWHM beam size of the observations. The crosses in the first row show the positions of the clumps and the black arrow in b show the location and the direction along which the N2 H+ spectra presented in Fig. 9 were taken.
Current usage metrics show cumulative count of Article Views (full-text article views including HTML views, PDF and ePub downloads, according to the available data) and Abstracts Views on Vision4Press platform.
Data correspond to usage on the plateform after 2015. The current usage metrics is available 48-96 hours after online publication and is updated daily on week days.
Initial download of the metrics may take a while.