Fig. 6
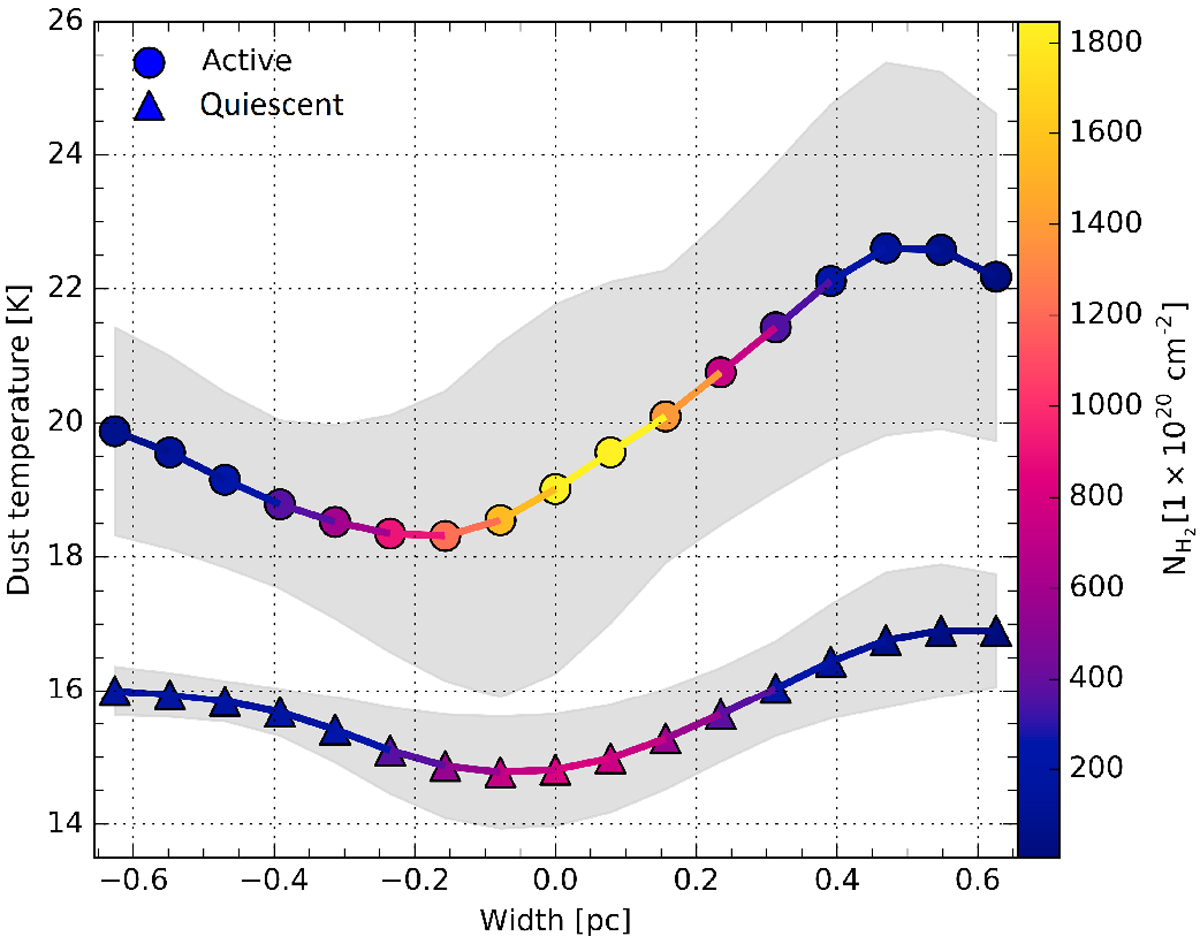
Mean transverse temperature profile averaged over the same limits as Fig. 5. The colour of solid line denotes the mean Herschel H2 column density profile where the circle and triangle markers show the dust temperature profile for the active and quiescent regions respectively. The translucent region shows the 1-sigma uncertainty range for the dust temperature.
Current usage metrics show cumulative count of Article Views (full-text article views including HTML views, PDF and ePub downloads, according to the available data) and Abstracts Views on Vision4Press platform.
Data correspond to usage on the plateform after 2015. The current usage metrics is available 48-96 hours after online publication and is updated daily on week days.
Initial download of the metrics may take a while.