Fig. 4
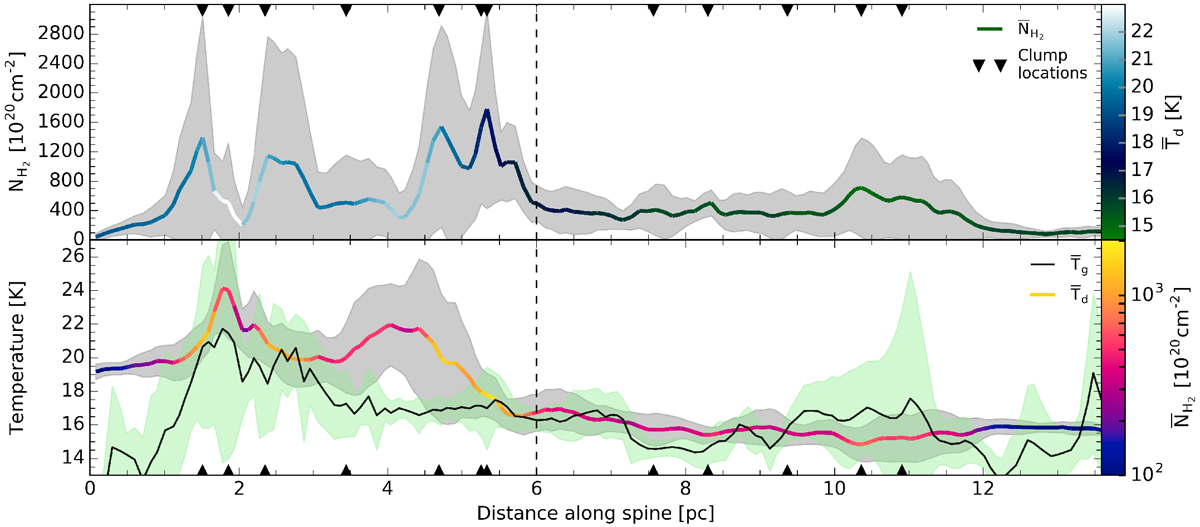
Background subtracted longitudinal column density (top), and longitudinal dust temperature (solid coloured line) and the gas temperature (solid black line) (bottom) between 0 and 13.6 pc and averaged over 2 × 0.63 pc (i.e. 0.63 pc either side of the spine). The thin black vertical dashed line marks the separation between the active half of the ridge (left) and the quiescent half (right). The colour of the solid line in the top panel corresponds to the dust temperature longitudinal profile of the bottom panel and the colour of the dust temperature line in the bottom panel corresponds to the H2 column density longitudinal profile in the top panel. Black triangles mark the clump positions and the translucent regions shows the 1-sigma uncertainty range for the values.
Current usage metrics show cumulative count of Article Views (full-text article views including HTML views, PDF and ePub downloads, according to the available data) and Abstracts Views on Vision4Press platform.
Data correspond to usage on the plateform after 2015. The current usage metrics is available 48-96 hours after online publication and is updated daily on week days.
Initial download of the metrics may take a while.