Fig. 3
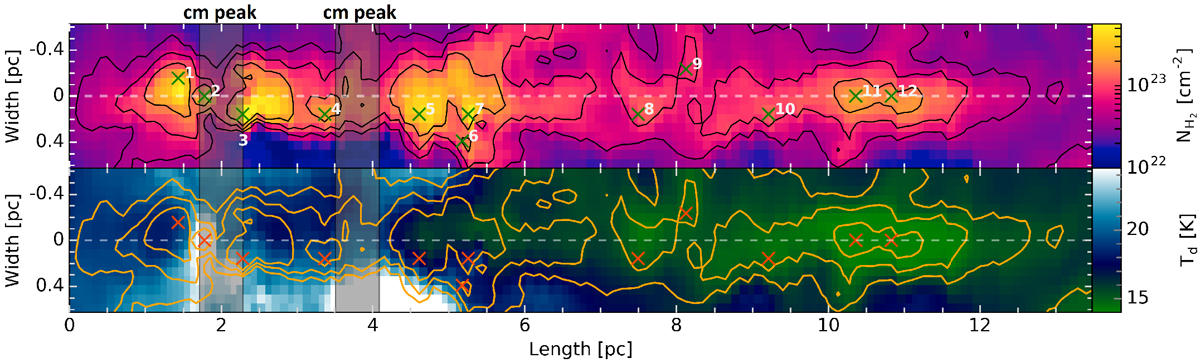
Straightened H2 column density map top and dust temperature map bottom with a width of 2 × 0.63 pc and length of 13.6 pc. Negative values along the y axis corresponds to the eastern offset from the spine centre, while along the x axis 0 pc corresponds to the most southern position of the spine. The black contours on (a) and the orange contours on (b) show H2 column density contours at 0.4, 0.8 and 1.6 × 1023 cm−2. Green and orange crosses mark the locations of the peak column density for each clump along with their ID #. White-dashed line shows where the centre of the spine is. The grey-shaded regions labeled “cm peak” correspond to the radio continuum peaks seen in SUMSS (see Fig. 1).
Current usage metrics show cumulative count of Article Views (full-text article views including HTML views, PDF and ePub downloads, according to the available data) and Abstracts Views on Vision4Press platform.
Data correspond to usage on the plateform after 2015. The current usage metrics is available 48-96 hours after online publication and is updated daily on week days.
Initial download of the metrics may take a while.