Fig. A.1
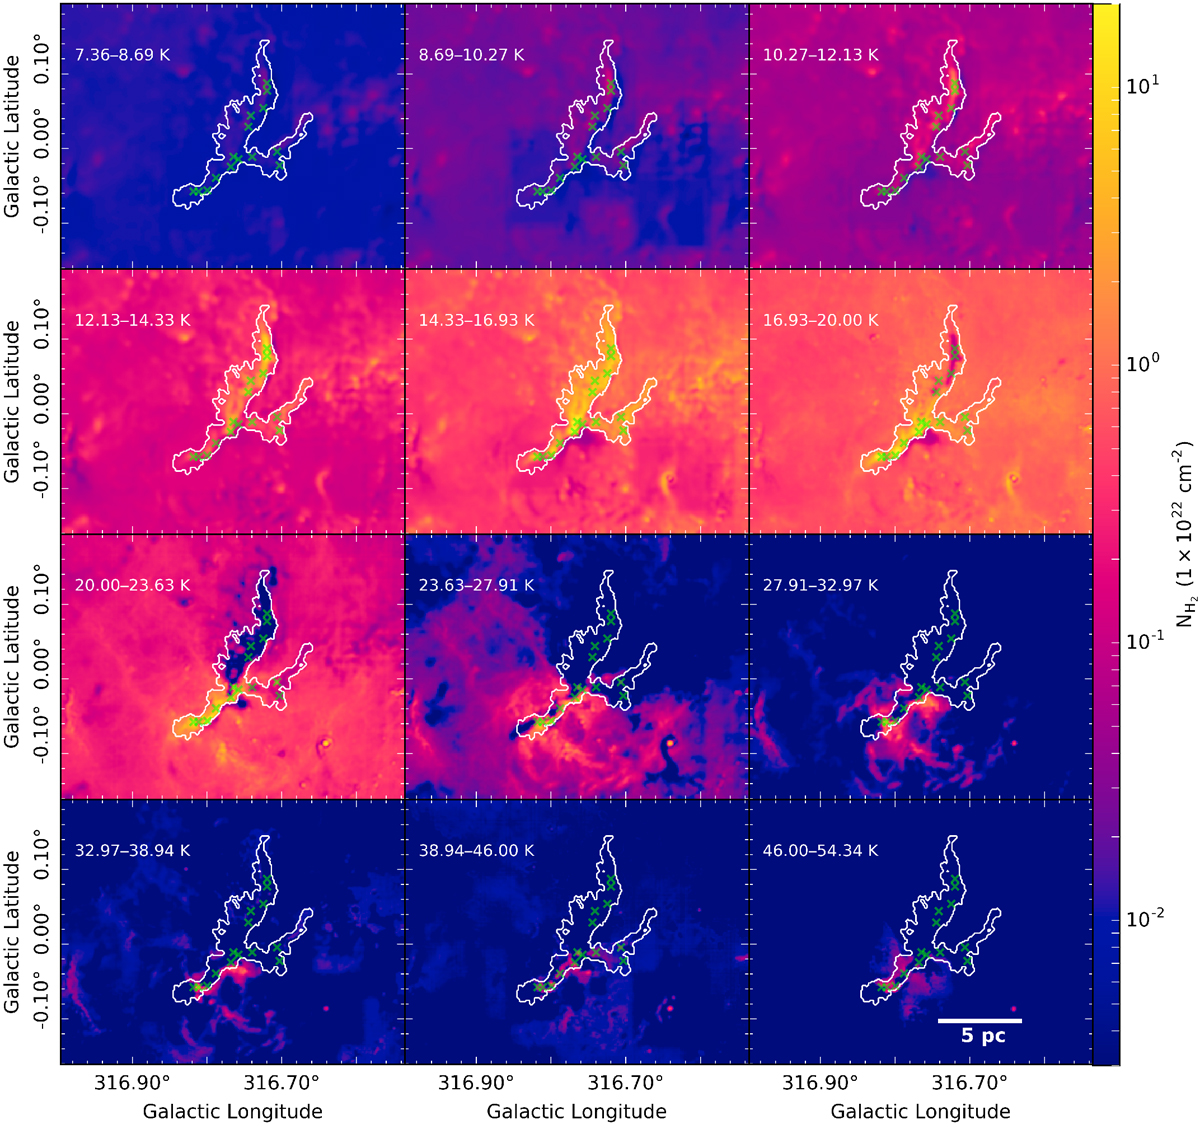
Differential column density of G316.75 over 12 temperature bands. The temperature bands used arelogarithmically distributed from 8 to 50 K. Each subplot has been labeled with the temperature band the column density represents. The white contour has the same meaning as Fig 7. Green crosses mark the location of the clumps present. Physical scale is 5 pc = 0.106°.
Current usage metrics show cumulative count of Article Views (full-text article views including HTML views, PDF and ePub downloads, according to the available data) and Abstracts Views on Vision4Press platform.
Data correspond to usage on the plateform after 2015. The current usage metrics is available 48-96 hours after online publication and is updated daily on week days.
Initial download of the metrics may take a while.