Free Access
Fig. 24
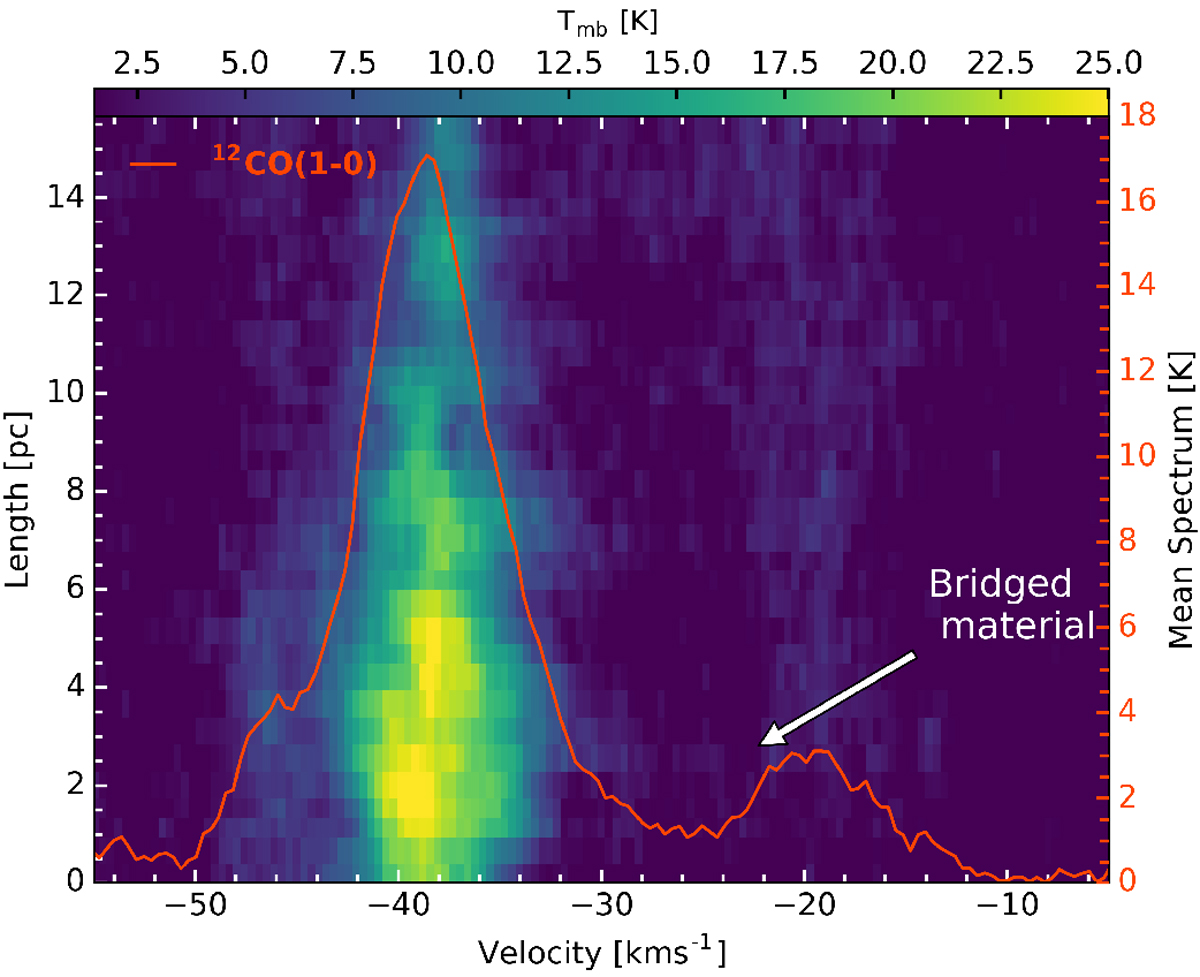
12CO (1–0) position-velocity diagram calculated using the same distance as Fig. 11. Over-plotted in orange is the 12CO (1–0) spectrum averaged over G316.75. The y axis on the right side corresponds to the mean spectrum. Arrows indicate a possible bridge feature.
Current usage metrics show cumulative count of Article Views (full-text article views including HTML views, PDF and ePub downloads, according to the available data) and Abstracts Views on Vision4Press platform.
Data correspond to usage on the plateform after 2015. The current usage metrics is available 48-96 hours after online publication and is updated daily on week days.
Initial download of the metrics may take a while.