Fig. 23
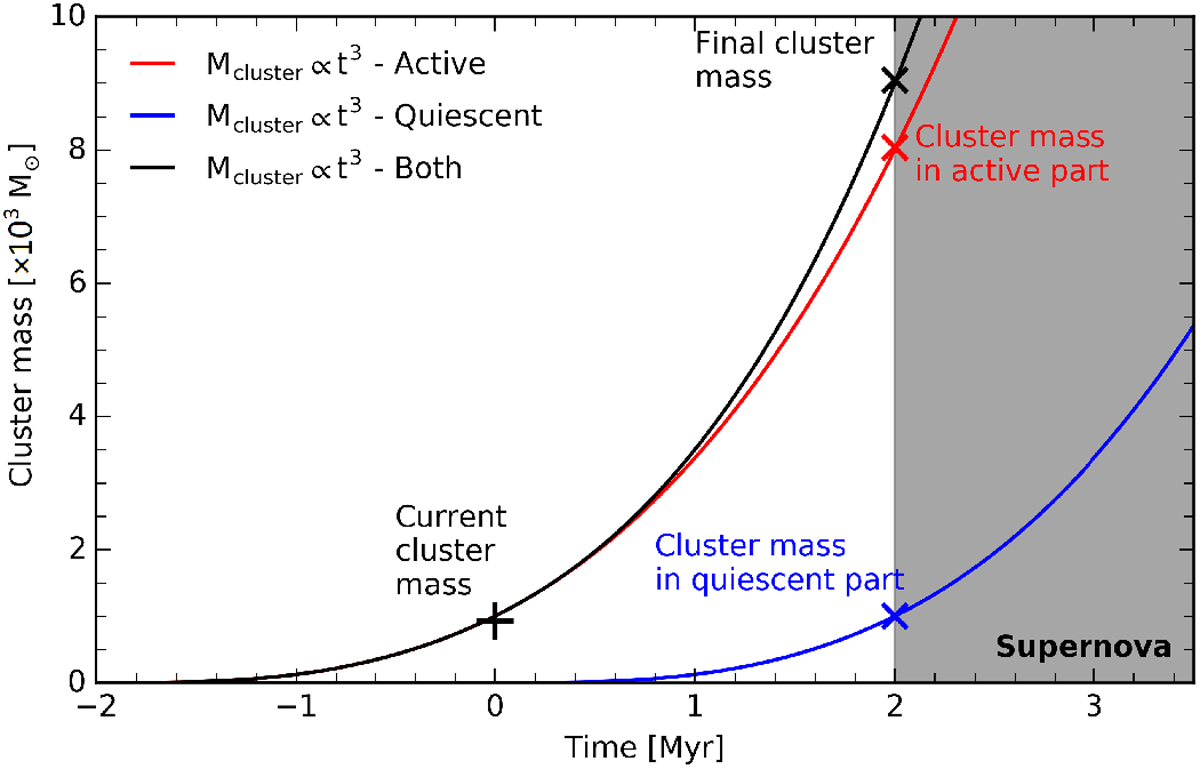
Illustrative figure of how the G316.75 stellar cluster mass might evolve in time. Time t = 0 Myr is now. The solid red, blue and black lines shows the time evolution of the cluster mass in the active region, the cluster mass in thequiescent region and the combined cluster mass respectively. Grey shaded region labeled as “supernova” indicates when a supernova explosion is expected. Labeled markers indicate current and predicted cluster masses as discussed in Sect. 7.1.
Current usage metrics show cumulative count of Article Views (full-text article views including HTML views, PDF and ePub downloads, according to the available data) and Abstracts Views on Vision4Press platform.
Data correspond to usage on the plateform after 2015. The current usage metrics is available 48-96 hours after online publication and is updated daily on week days.
Initial download of the metrics may take a while.